Energy Supply Chain: From Wellhead to Pump
A barrel of oil travels thousands of miles and changes hands multiple times before becoming the gasoline in your tank. The energy supply chain divides into three distinct segments—upstream, midstream, and downstream—each with different business models, risk profiles, and profit drivers. The point is: understanding this value chain helps investors analyze energy companies, interpret refining margins, and recognize where bottlenecks affect prices.
The Three Segments of Energy
The petroleum industry organizes around a simple flow:
Upstream → Midstream → Downstream
- Upstream: Find and extract crude oil and natural gas from the ground
- Midstream: Move and store hydrocarbons from production sites to processing facilities
- Downstream: Refine crude into usable products and distribute to end consumers
Each segment has distinct economics. Upstream profits depend on commodity prices. Midstream profits depend on throughput volumes. Downstream profits depend on the spread between crude costs and product prices.
Upstream: Exploration and Production
What happens here: Companies locate oil and gas deposits, drill wells, and extract hydrocarbons from underground reservoirs.
Key activities:
- Exploration: Seismic surveys, geological analysis, exploratory drilling to find reserves
- Development: Building production infrastructure (wells, platforms, gathering systems)
- Production: Extracting crude oil and natural gas from proven reserves
Business model: Sell raw crude oil and natural gas at market prices. Profitability depends entirely on the spread between realized commodity prices and production costs (finding costs, drilling costs, lifting costs).
Key players:
- E&P companies (Exploration & Production): ConocoPhillips, EOG Resources, Pioneer Natural Resources
- Integrated majors (with upstream operations): ExxonMobil, Chevron, Shell
- National oil companies: Saudi Aramco, Petrobras, Equinor
Primary risks:
- Commodity price volatility: A $10 drop in oil prices directly reduces revenue
- Geological risk: Wells may produce less than expected or hit dry holes
- Depletion: Existing wells decline over time, requiring continuous drilling to maintain production
- Capital intensity: Drilling programs require massive upfront investment before revenue flows
Sample economics:
- Average US shale well cost: $6-8 million to drill and complete
- Typical breakeven price: $40-55 per barrel (varies by basin)
- Decline rate: 50-70% production loss in first year for shale wells
Midstream: Transportation and Storage
What happens here: Companies move crude oil and natural gas from production sites to refineries, processing plants, and export terminals. They also store hydrocarbons to balance supply and demand timing.
Key assets:
- Pipelines: The primary method for moving crude oil and natural gas over land. Major systems include Permian Basin gathering lines, the Colonial Pipeline, and the Keystone system.
- Storage terminals: Tank farms that hold crude and refined products. Cushing, Oklahoma holds approximately 90 million barrels of crude storage capacity.
- Marine terminals: Loading and unloading facilities for tankers at ports
- Rail and trucking: Alternative transport when pipelines are unavailable or at capacity
Business model: Charge fees (tariffs) for transporting and storing hydrocarbons. Most midstream contracts use "take-or-pay" structures, where shippers pay regardless of actual volumes shipped. This creates stable, predictable cash flows.
Key players:
- MLPs (Master Limited Partnerships): Enterprise Products Partners, Kinder Morgan, Williams Companies
- Midstream corporations: Targa Resources, ONEOK
Primary risks:
- Volume risk: If upstream production declines, pipeline throughput falls
- Regulatory risk: Pipeline permitting has become increasingly difficult and politically contentious
- Contract renewal risk: Tariff rates may be renegotiated lower when contracts expire
- Maintenance and integrity: Aging infrastructure requires ongoing capital expenditure
Sample economics:
- Pipeline tariff: $1-4 per barrel transported, depending on distance and competition
- Storage fee: $0.30-0.60 per barrel per month
- Midstream companies typically target 4-6x debt/EBITDA leverage ratios
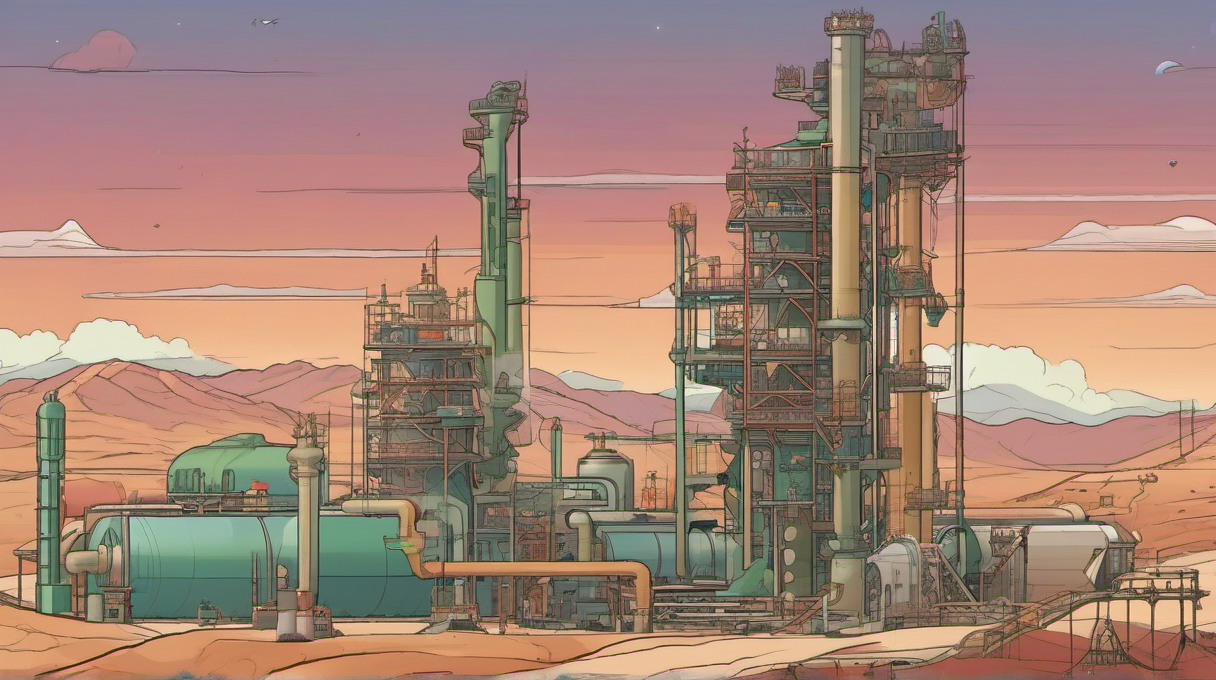
Downstream: Refining and Marketing
What happens here: Refineries convert crude oil into usable products (gasoline, diesel, jet fuel, heating oil, petrochemical feedstocks). Marketers then distribute and sell these products to end consumers through wholesale and retail channels.
Key activities:
- Refining: Processing crude oil through distillation, cracking, and treatment units
- Blending: Creating finished fuels that meet regulatory specifications
- Marketing: Wholesale distribution to jobbers and retail sales through branded gas stations
Business model: Buy crude oil as input, sell refined products as output. Profitability depends on the "crack spread"—the difference between refined product prices and crude oil costs. Refiners also earn from optimization (selecting the best crude slate for their configuration).
Key players:
- Independent refiners: Valero, Marathon Petroleum, Phillips 66, PBF Energy
- Integrated majors (with refining): ExxonMobil, Chevron, Shell
- Retailers: Convenience store chains, branded and unbranded gas stations
Primary risks:
- Margin volatility: Crack spreads fluctuate based on product demand, crude costs, and refinery outages
- Regulatory compliance: Environmental regulations require ongoing investment
- Demand shifts: Electric vehicle adoption threatens long-term gasoline demand
- Turnaround costs: Refineries require periodic shutdowns for maintenance (every 4-5 years), during which no revenue flows but costs continue
Sample economics:
- US refining capacity: approximately 18 million barrels per day
- Typical refining margin: $10-20 per barrel processed (varies widely by region and configuration)
- Turnaround cost: $100-500 million depending on refinery size and scope
The Value Chain: From Wellhead to Pump
Here's how a barrel of crude becomes gasoline in your car:
Stage 1: Production (Upstream)
- Oil extracted from Permian Basin well in West Texas
- Sold at wellhead price: approximately $70 per barrel (WTI minus regional differential)
Stage 2: Gathering (Midstream)
- Crude flows through gathering pipelines to a central delivery point
- Gathering fee: $1.50 per barrel
Stage 3: Long-Haul Transport (Midstream)
- Pipeline moves crude from West Texas to Gulf Coast refinery
- Transport tariff: $2.50 per barrel
Stage 4: Refining (Downstream)
- Refinery processes crude into approximately 19 gallons of gasoline, 12 gallons of diesel, and other products per 42-gallon barrel
- Refining margin captured: $15 per barrel (crack spread)
Stage 5: Product Distribution (Downstream)
- Gasoline transported via pipeline (Colonial Pipeline) to East Coast terminals
- Product pipeline tariff: $1.00 per barrel equivalent
Stage 6: Retail (Downstream)
- Gasoline sold at retail pump
- Retail margin: $0.10-0.20 per gallon (roughly $5-8 per barrel equivalent)
Value captured at each stage:
| Segment | Value per Barrel |
|---|---|
| Upstream (crude sale) | $70.00 (commodity price) |
| Midstream (transport) | $5.00 (fees) |
| Downstream (refining) | $15.00 (crack spread) |
| Downstream (retail) | $6.00 (retail margin) |
Bottlenecks and Price Impacts
Constraints at any stage affect the entire chain:
Upstream bottleneck (production): When OPEC+ cuts output or US shale producers slow drilling, reduced crude supply pushes prices higher across the chain. Brent and WTI prices rise.
Midstream bottleneck (transport): Pipeline capacity constraints trap crude in producing regions. In 2018-2019, Permian Basin crude traded $15-20 per barrel below WTI because pipeline capacity couldn't keep up with production growth. Midcontinent producers suffered while Gulf Coast refiners benefited from discounted crude.
Downstream bottleneck (refining): Refinery outages (unplanned or scheduled turnarounds) reduce product supply even when crude is plentiful. Hurricane-related refinery shutdowns on the Gulf Coast can spike gasoline prices while crude prices remain stable or fall.
Demand destruction: When product demand collapses (as in April 2020), refineries cut runs, crude demand falls, and the entire chain suffers. WTI briefly went negative because no one wanted crude when refineries weren't buying.
Integrated vs. Pure-Play Companies
Integrated oil companies (ExxonMobil, Chevron, Shell) operate across all three segments. Integration provides natural hedges: when crude prices fall, their upstream suffers but their refining margins often improve.
Pure-play companies focus on one segment:
- E&P companies have maximum leverage to commodity prices
- MLPs offer stable, yield-oriented returns with less commodity sensitivity
- Independent refiners profit from crack spreads regardless of absolute crude prices
The tradeoff: Integrated companies offer diversification but less upside when any single segment performs exceptionally. Pure-plays offer concentrated exposure to specific profit drivers.
Key Takeaways
-
Three segments, three profit drivers: Upstream depends on commodity prices, midstream on throughput volumes, downstream on crack spreads
-
Each segment has distinct risks: Upstream faces price and geological risk; midstream faces volume and regulatory risk; downstream faces margin volatility and demand shifts
-
Typical refining margin: $10-20 per barrel. This is the value added by converting crude into finished products
-
Bottlenecks anywhere affect prices everywhere: Pipeline constraints, refinery outages, or production cuts ripple through the entire value chain
-
Integrated companies hedge; pure-plays concentrate: Choose exposure based on your view of which segment offers the best risk-adjusted returns
Related: Crack Spreads and Refining Margins | Oil Market Structure: Brent vs. WTI | Inventory Reports (EIA, API) and Price Impact
Related Articles
Metals Markets: Precious vs. Industrial
The differences between precious metals (gold, silver, platinum) and industrial metals (copper, aluminum, zinc), with distinct demand drivers, trading venues, and price behaviors.
Geopolitical Risks in Energy Markets
How chokepoints, sanctions, and supply disruptions affect global oil and gas prices.

Election Cycles and Market Volatility
Elections create policy uncertainty that affects market volatility and sector performance. Understanding historical patterns and policy uncertainty indicators helps investors navigate election periods.