Commodities and Energy Markets
Commodities — oil, gold, agricultural products, metals — respond to supply and demand dynamics that are fundamentally different from stocks and bonds. These articles cover how commodity markets work, the role of futures in price discovery, and how energy transitions, weather events, and geopolitical disruptions create both risks and opportunities.
Natural Gas Pricing Hubs and Seasonality
How natural gas pricing works across regional hubs, with seasonal patterns that create predictable price swings of $1-3/MMBtu between winter and summer.
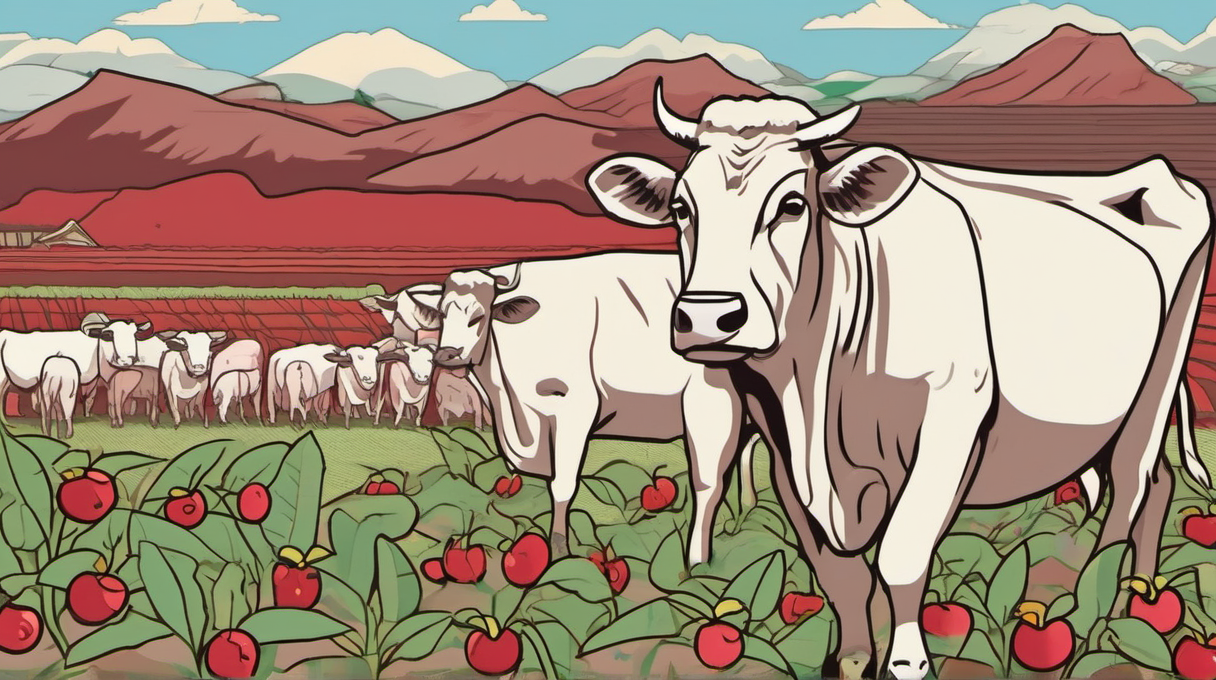
Livestock and Soft Commodities Basics
Understand livestock markets (cattle, hogs) and soft commodities (coffee, sugar, cocoa, cotton) including production cycles, major producers, and price drivers.

Contango vs. Backwardation Explained
Understand futures curve shapes, how contango and backwardation affect roll yield, and what drives each market condition.
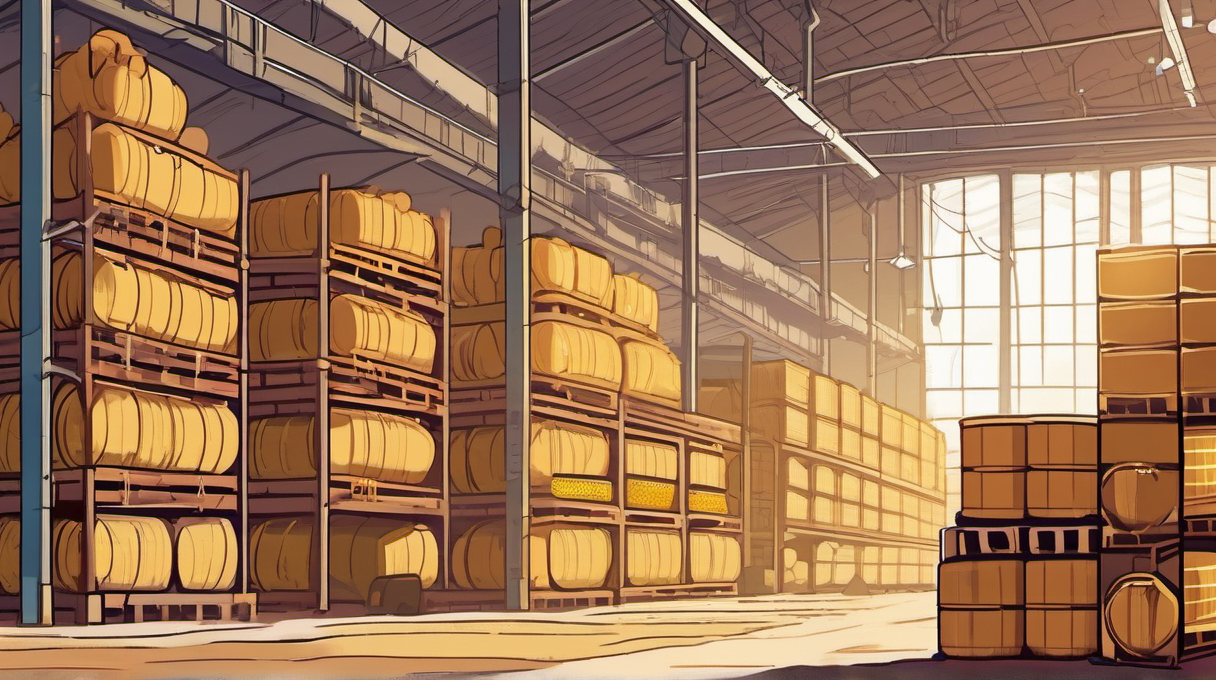
Storage Costs and Convenience Yield
Learn the cost of carry model for commodity futures pricing, including storage costs, convenience yield, and how these factors determine whether markets trade at full carry.
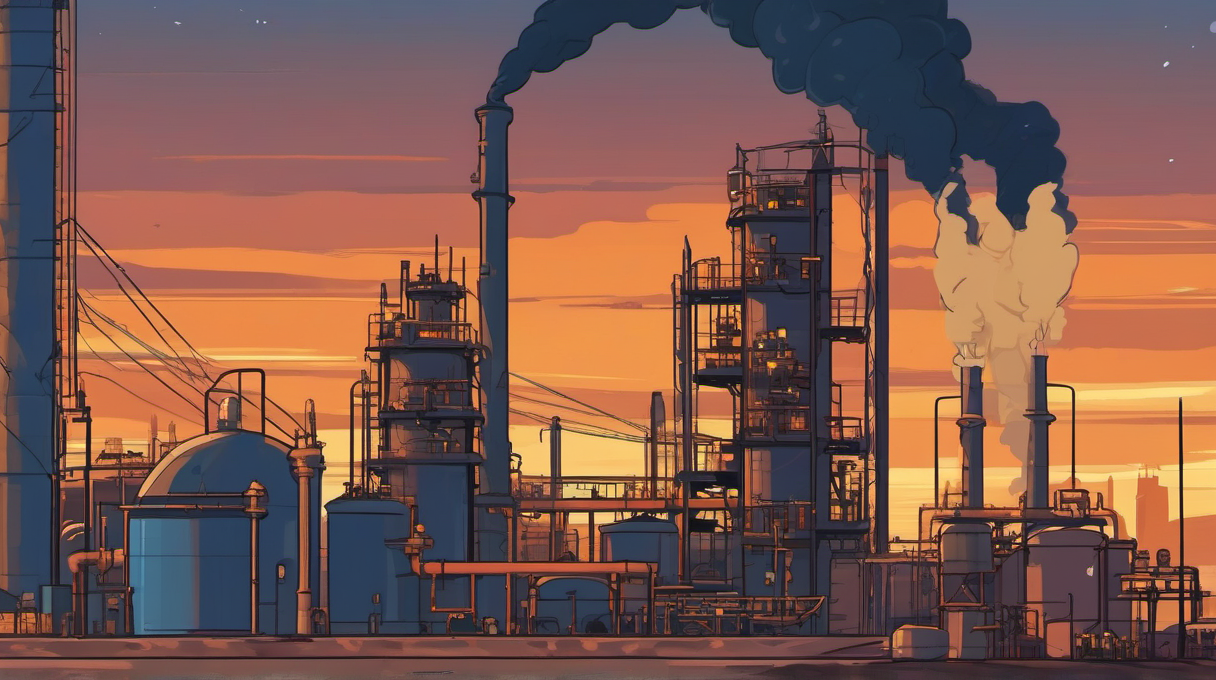
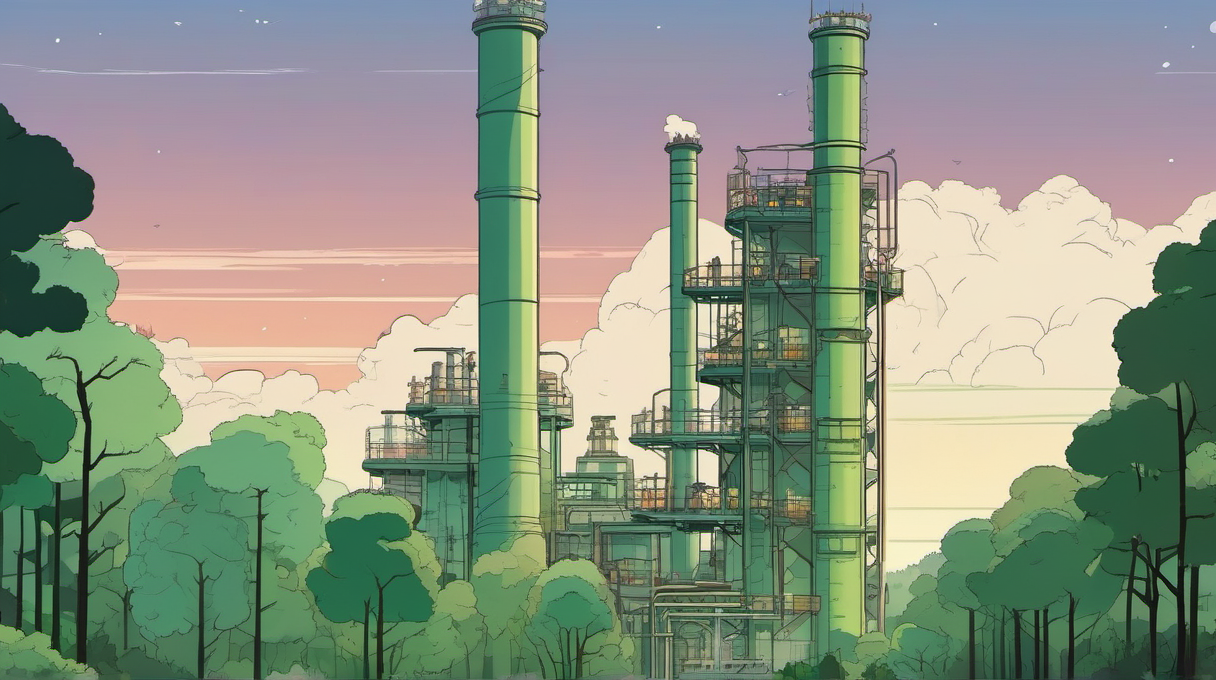
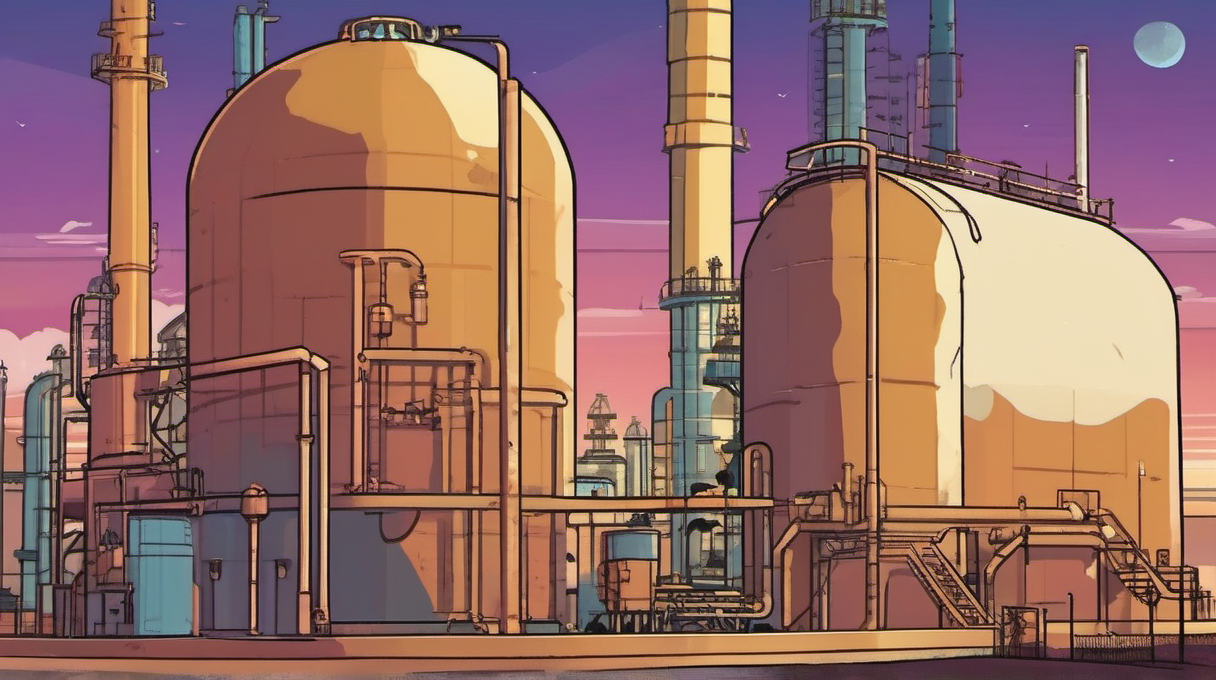
Crack Spreads and Refining Margins
How refiners measure profitability through crack spreads, the formulas behind common spread calculations, and what drives refining margin volatility.
Oil Market Structure: Brent vs. WTI
How the two dominant crude oil benchmarks differ in quality, delivery, and pricing, and why the spread between them matters for energy investors.
Commodity Index Construction
Learn how major commodity indexes are built, including weighting methods, roll mechanics, and return components that drive index performance.

Copper as an Economic Indicator
Why copper prices signal economic health, with China consuming 50% of global supply and prices correlating strongly with manufacturing PMIs and GDP growth.
Carbon Markets and Renewable Energy Credits
Most investors treat carbon markets as an ESG curiosity, something for sustainability reports and corporate pledges. That instinct is expensive. The EU Emissions Trading System alone has generated EUR 245 billion in revenue since launch, EU carbon prices hit EUR 83.79 per tonne in late 2025 (up 3...
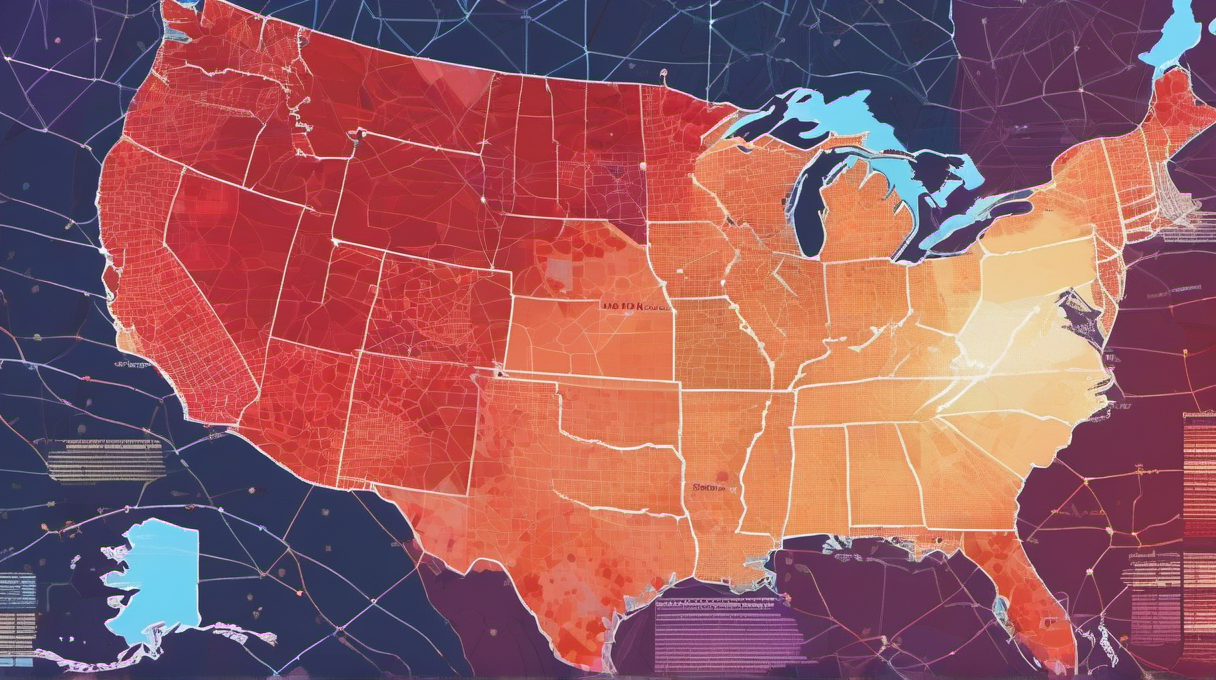
Electricity Markets and Regional Differences
How US electricity markets operate through regional grid operators, with prices ranging from $30/MWh in off-peak hours to $500+/MWh during peak demand events.
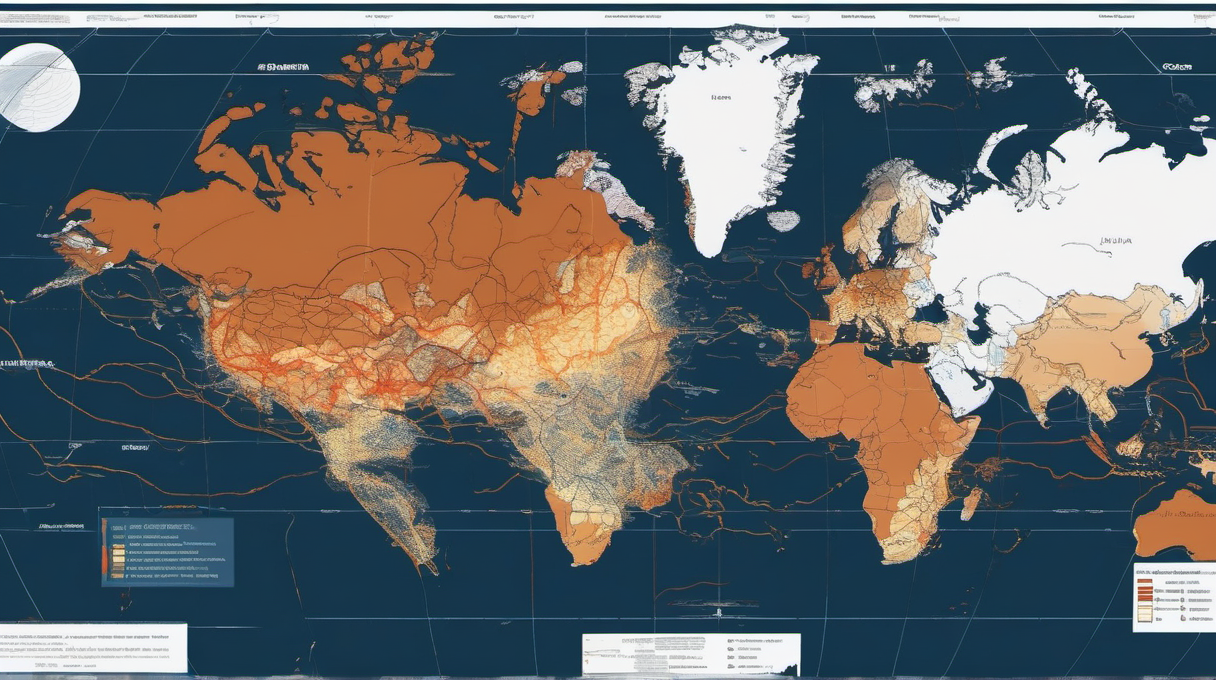
Geopolitical Risks in Energy Markets
How chokepoints, sanctions, and supply disruptions affect global oil and gas prices.

Hedging Programs for Producers and Consumers
Learn how commodity producers and consumers use futures, swaps, and options to manage price risk, including hedge ratios, tenor decisions, and governance frameworks.

Investing via Futures, ETFs, and Stocks
Between 2009 and 2019, crude oil spot prices roughly doubled. Over that same period, USO—the largest oil ETF—lost money. Not underperformed. Lost money. The culprit wasn't oil prices. It was the invisible tax that futures-based commodity vehicles pay every month: roll costs in contango markets, w...
Inventory Reports (EIA, API) and Price Impact
How the weekly EIA and API petroleum inventory reports influence oil prices, and what to watch when interpreting the data.

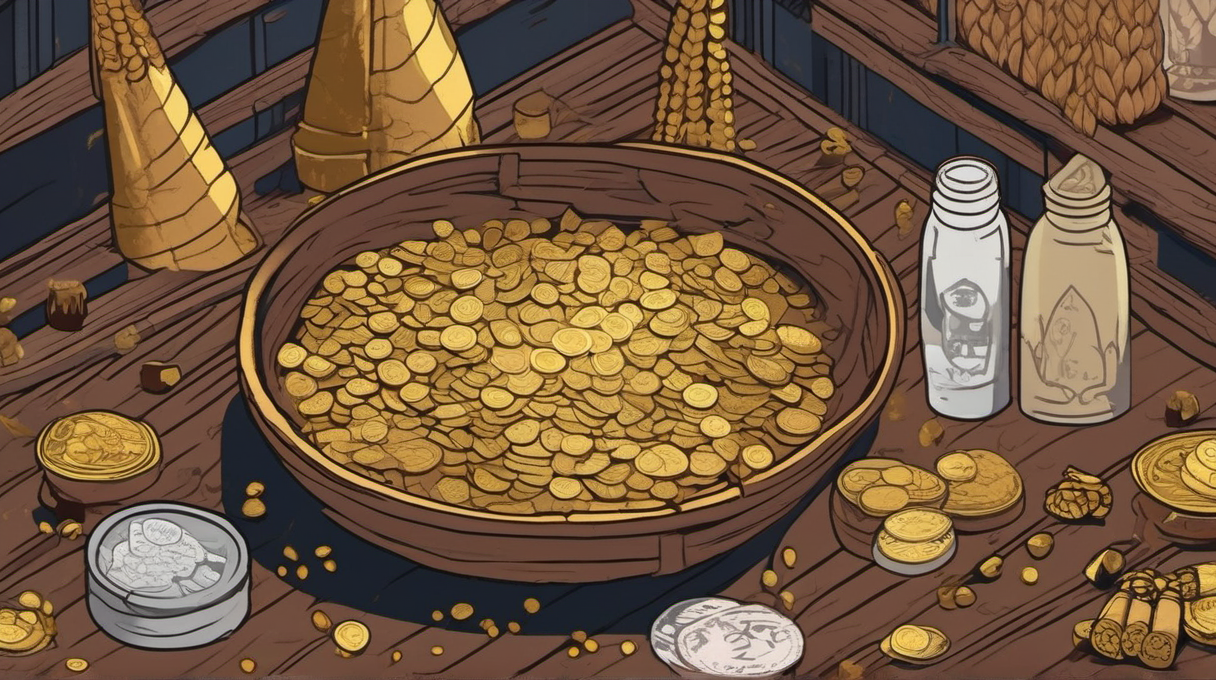
Metals Markets: Precious vs. Industrial
The differences between precious metals (gold, silver, platinum) and industrial metals (copper, aluminum, zinc), with distinct demand drivers, trading venues, and price behaviors.

Agricultural Commodities and Seasonality
In 2012, a single drought across the US Corn Belt wiped out 16% of expected corn yield in a matter of weeks, sending prices from $5.50 to $8.30 per bushel—a 50% spike that rippled through feed costs, ethanol markets, and grocery bills worldwide. In 2022, Russia's invasion of Ukraine drove wheat p...
OPEC+ Policy and US Shale Response
How OPEC+ production quotas interact with US shale economics, and why the balance between these two forces drives global oil prices.
Glossary: Commodity and Energy Terms
Quick-reference definitions for essential commodity and energy market terminology.
Regulatory Environment for US Commodities
The key regulators, position limits, and reporting requirements governing US commodity futures and physical energy markets.
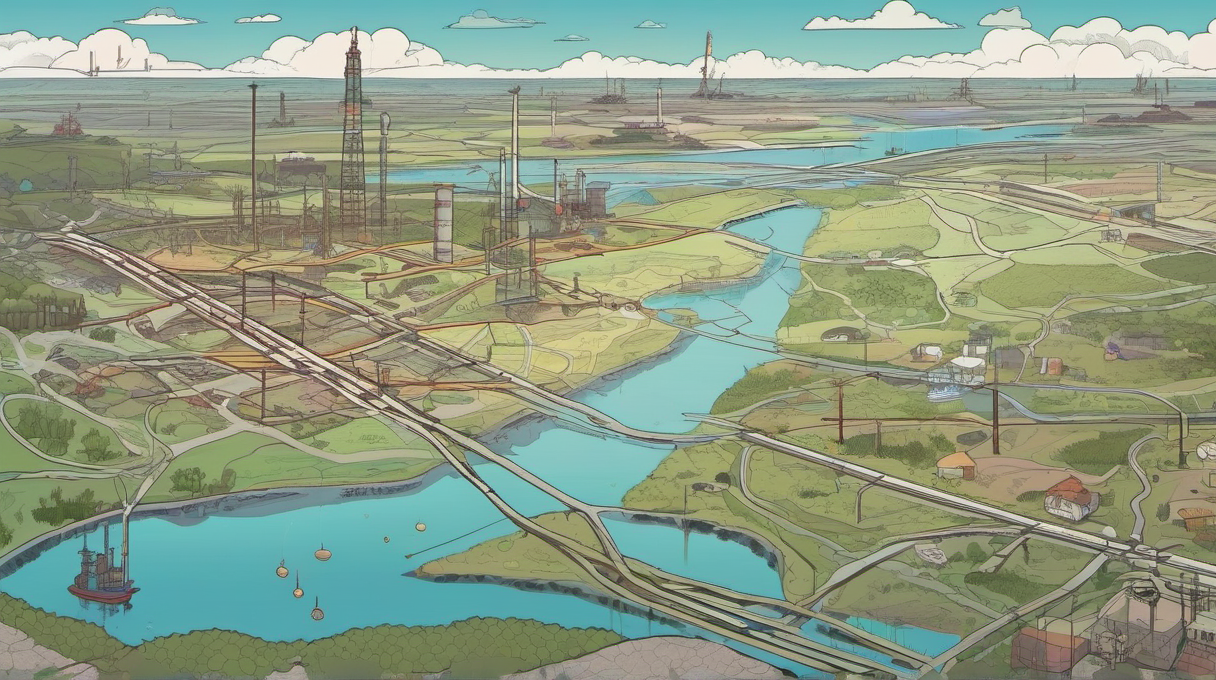
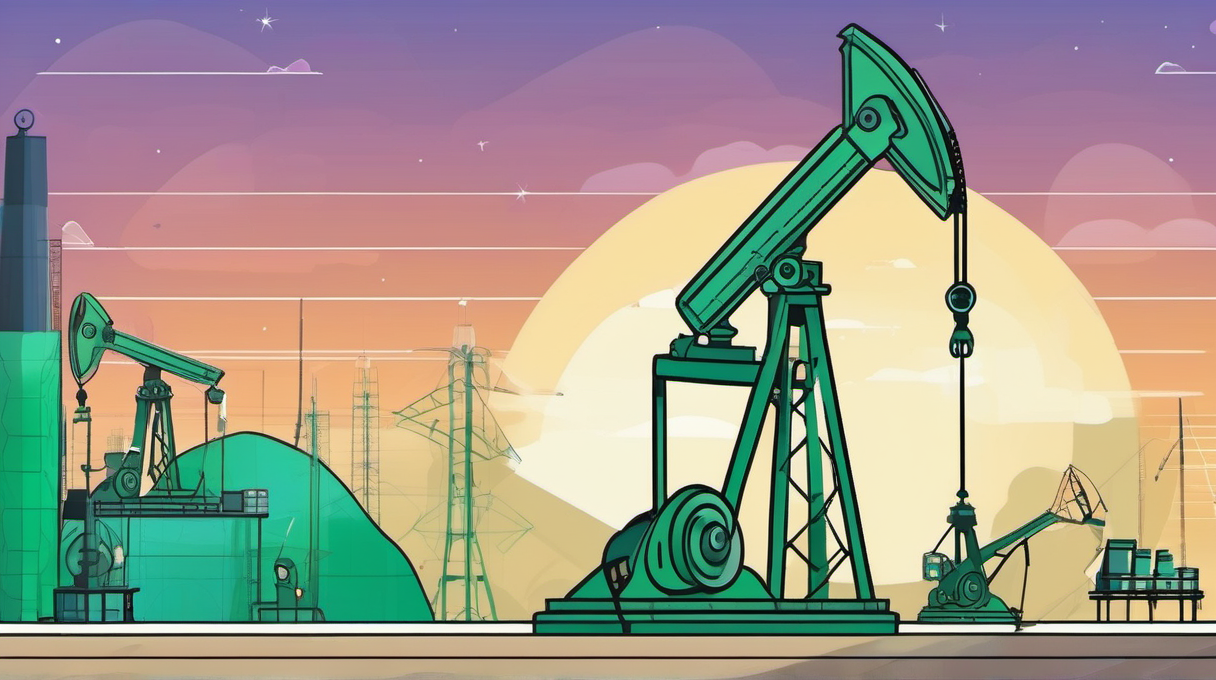
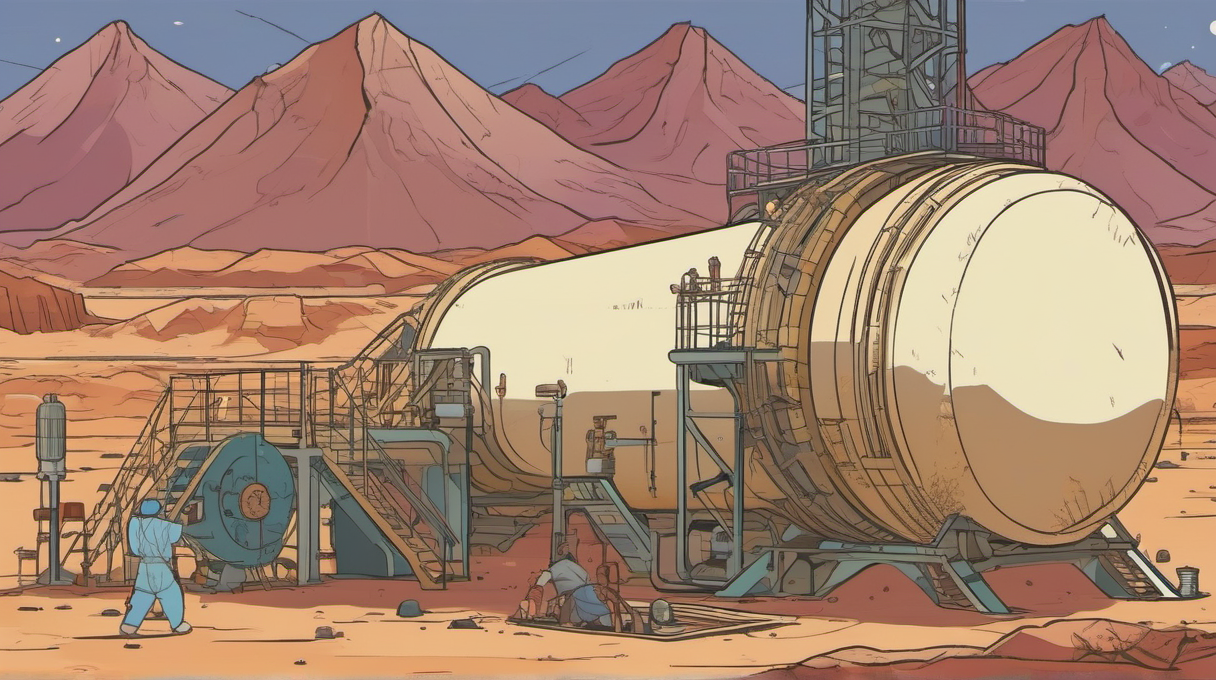
Energy Supply Chain: From Wellhead to Pump
How crude oil moves through the upstream, midstream, and downstream segments, and where value is created at each stage of the energy supply chain.