The $4 Billion Whisper: How One Earnings Call Ignited the AI Trade
The Setup
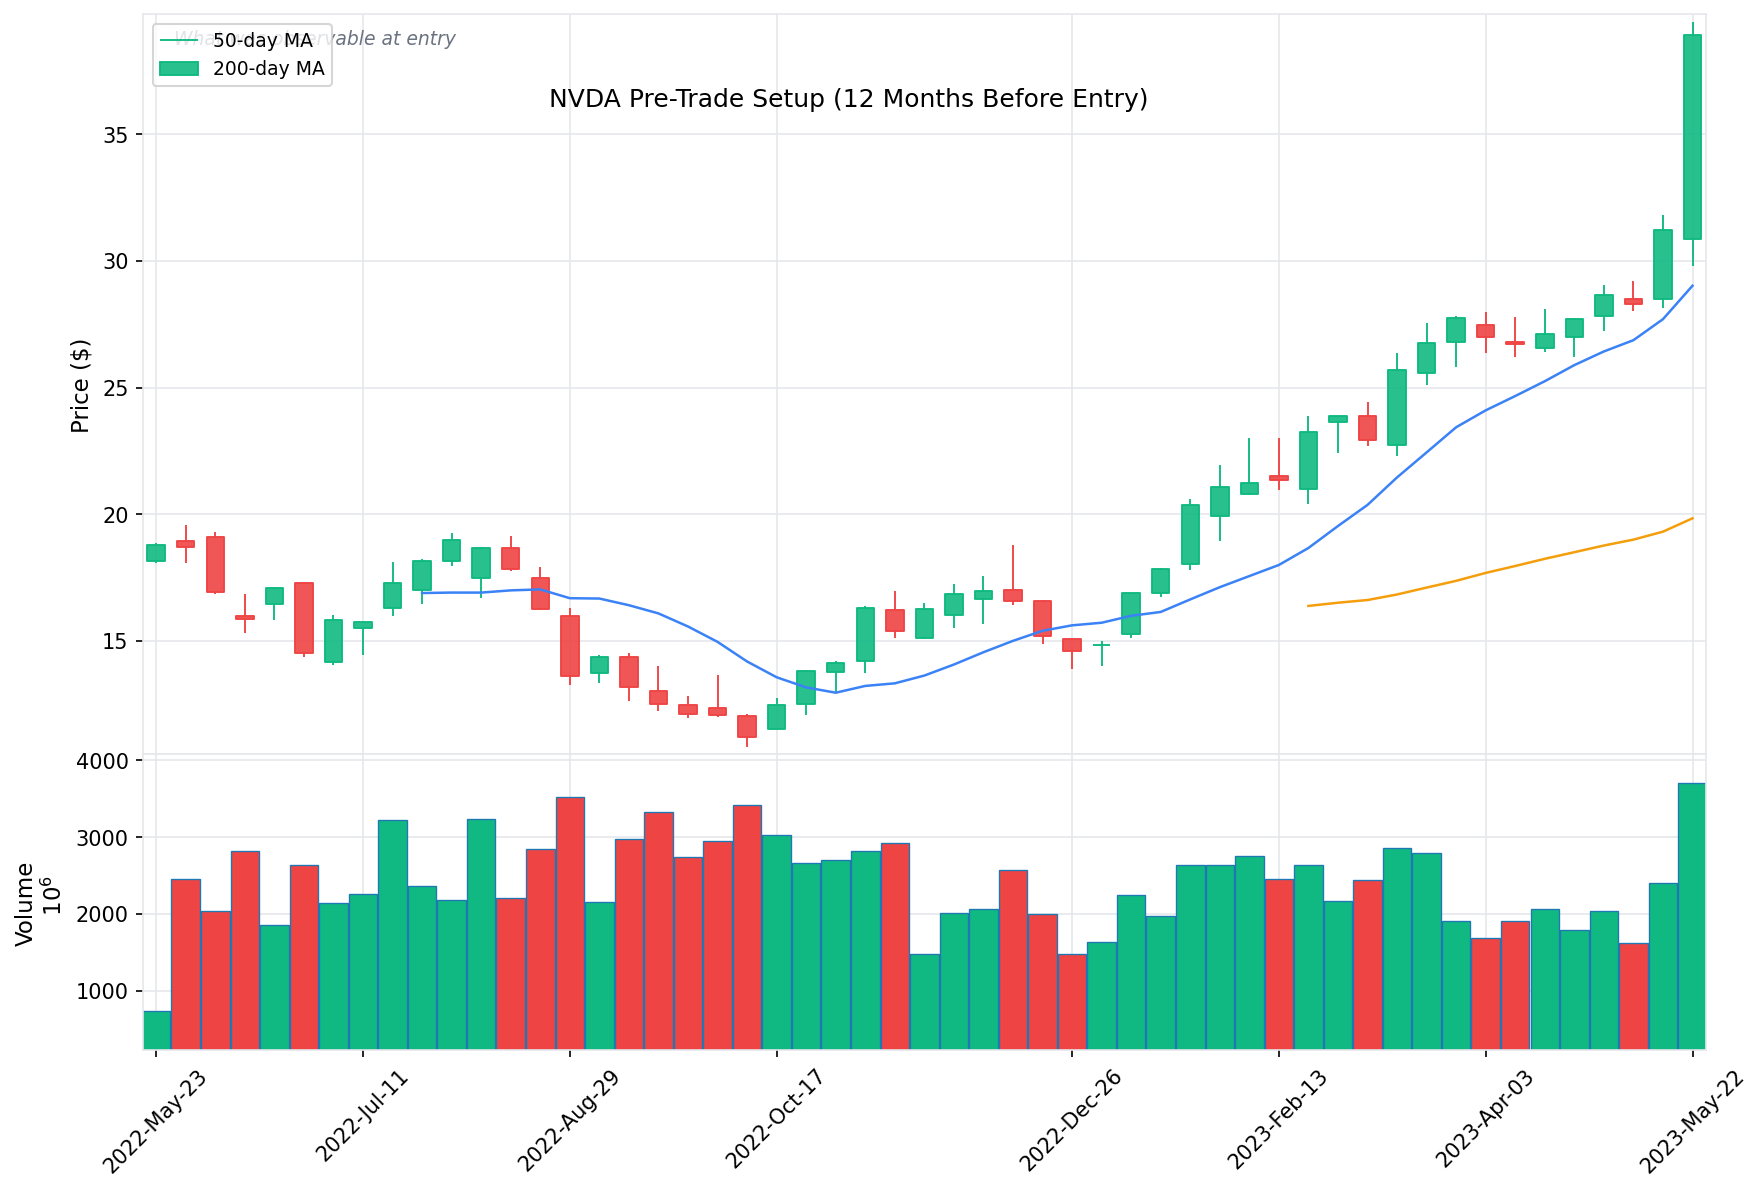
What the world looked like at entry
On May 22, 2023, NVIDIA opened the week at $30.90 per share—a semiconductor company riding quiet momentum from a technology that most investors were still trying to understand. Two days later, after the close on May 24, NVIDIA reported Q1 FY2024 earnings and issued Q2 revenue guidance of $11 billion, roughly $4 billion above the $7.2 billion Wall Street consensus. The stock exploded. By the end of that entry week, NVDA had surged to $38.95, a 26% intraweek move that marked the single most consequential earnings report of the AI era.
What followed was a three-month holding period defined by the tension between historic demand for AI infrastructure and the market's struggle to value a company growing faster than anyone's models could accommodate. NVDA climbed to a peak weekly close of $46.75 by July 24 as NVIDIA approached and then breached the $1 trillion market capitalization barrier. But the path was far from smooth—a 12.6% drawdown from that peak to a close of $40.86 on August 7 tested conviction, driven by valuation jitters, profit-taking, and simmering concerns about U.S. chip export restrictions to China.
By the exit week of August 21, NVDA closed at $46.02, delivering an 18.15% return against the S&P 500's 4.75% gain over the same period—an alpha of roughly 13.40 percentage points. This case study examines the trade that launched a thousand AI narratives: what was visible before the catalyst, how price action unfolded in the aftermath of a generational earnings surprise, and what the volatility taught about riding a parabolic thesis.
MACRO REGIME
- Fed Funds rate at 5.00–5.25%, with the market debating whether additional hikes were coming
- Regional banking stress (SVB collapse in March 2023) had briefly rattled markets but was contained
- S&P 500 recovering steadily, with tech leading the way back from 2022 bear market lows
- ChatGPT had launched in November 2022 and reached 100 million monthly active users within two months, the fastest-growing consumer application in history
COMPANY SETUP
- NVDA had climbed from $21.00 (week of February 20) to $31.26 (week of May 15), a 49% run-up in the lead-in period alone
- Q4 FY2023 results (reported February 2023) had shown data center revenue of $3.6 billion, already hinting at AI-driven demand
- The H100 GPU had entered production and was experiencing acute shortages, with hyperscalers and AI startups competing for allocation
- Analysts were cautiously raising estimates but remained anchored to pre-AI demand models; consensus Q2 revenue was $7.2 billion
- NVDA was trading at approximately 25x forward revenue—expensive by historical standards, but cheap by what was coming
SECTOR MOMENTUM
- AMD was racing to compete with its MI300 accelerator, scheduled for late 2023 launch
- Microsoft had invested $10 billion in OpenAI and was integrating AI across its product stack
- Google had rushed to launch Bard in February 2023 in response to ChatGPT
- Cloud hyperscalers (AWS, Azure, GCP) were signaling increased capital expenditure for AI infrastructure
- The semiconductor sector (SOX index) was outperforming the broader market by a widening margin
SENTIMENT
- AI enthusiasm was building but still concentrated among tech-focused investors; many institutional allocators remained skeptical about the durability of the demand cycle
- Short interest on NVDA was modest but present, with bears arguing that the AI trade was overhyped
- Sell-side price targets ranged widely, with most anchored to pre-ChatGPT demand assumptions
- Retail sentiment was increasingly bullish, with NVDA becoming one of the most-discussed tickers on social media
Entry Point
The thesis and the position
The bull case for entering NVDA in late May 2023 was straightforward: the world was about to undergo a fundamental shift in computing infrastructure, and NVIDIA owned the picks and shovels. ChatGPT had proven that large language models could deliver transformative consumer experiences, and every major technology company was racing to deploy generative AI. That meant they all needed NVIDIA's GPUs—specifically the H100—and demand was already outstripping supply. The lead-in price action, from $21.00 in February to $31.26 by mid-May, confirmed that the market was beginning to discount this reality. If the May 24 earnings report validated the AI demand thesis, the stock had room to re-rate dramatically higher.
The bear case was equally direct: NVDA had already rallied 49% from its February lows before reporting earnings, meaning a lot of good news was priced in. Semiconductor cycles are notoriously boom-and-bust, and investors had been burned before by extrapolating peak demand—the crypto GPU bust of 2022 was barely twelve months old. Valuation multiples were stretched, China export restrictions could limit the addressable market, and the competitive landscape was shifting with AMD's MI300 and custom silicon from Google (TPU) and Amazon (Trainium) potentially eroding NVIDIA's moat. Buying at $38.95 after a 26% earnings week meant paying a hefty admission price to a party that might already be crowded.
Before continuing: Consider what you would have done.
The Journey
From entry to exit
Key Events
| Date | Event | Category | Stock Reaction |
|---|---|---|---|
| May 22, 2023 | Entry week begins; NVDA opens at $30.90 | Entry | Week low of $29.81 before the earnings catalyst |
| May 24, 2023 | Q1 FY2024 earnings: revenue $7.19B, Q2 guidance $11B (vs. $7.2B consensus) | Earnings | Stock surges 26% after-hours; closes the week at $38.95 |
| May 30, 2023 | NVDA briefly crosses $1 trillion market cap intraday | Milestone | Week close $39.33, consolidation begins |
| Jun 12, 2023 | Broad tech rally; AI-related names (AMD, MSFT, GOOGL) surge in sympathy | Sector | NVDA closes week at $42.69, breakout to new high |
| Jun 26, 2023 | Profit-taking and rotation set in after extended rally | Sentiment | Flat week, close at $42.30 |
| Jul 10, 2023 | Renewed buying on data center demand reports; analyst upgrades accelerate | Fundamental | NVDA surges to $45.47 weekly close |
| Jul 24, 2023 | Peak weekly close at $46.75; valuation concerns surface | Peak | Best close of the trade period |
| Aug 7, 2023 | Selloff accelerates; China export restriction fears, profit-taking | Geopolitical | NVDA drops to $40.86 weekly close (-12.6% from peak) |
| Aug 21, 2023 | Recovery ahead of Q2 FY2024 earnings (Aug 23); exit at $46.02 | Exit | Strong bounce from August lows |
How It Unfolded
Phase 1: The Earnings Earthquake (May 22 - June 5)
The week of May 22 was unlike anything the semiconductor sector had ever seen. NVDA opened Monday at $30.90, and for two days the market waited. On Wednesday, May 24, after the close, NVIDIA dropped numbers that redrew the map. Revenue of $7.19 billion beat consensus, but the real shock was the Q2 guidance: $11 billion, plus or minus 2%. Analysts expecting $7.2 billion were suddenly staring at a 53% beat on forward revenue. Data center revenue hit a record $4.28 billion for Q1. The after-hours move was immediate and violent—NVDA gained 26% in a single session.
By Friday's close, the stock had settled at $38.95. The following week brought the $1 trillion market cap milestone, with NVDA closing at $39.33. But the consolidation that week—with an intraweek range of $37.82 to $41.94—told you the market was digesting. A move this large needed time to build a base. The earnings report hadn't just beaten estimates; it had forced every analyst on Wall Street to rebuild their models from scratch.
Phase 2: The Sympathy Rally and Broadening Trade (June 5 - June 26)
With NVDA's earnings serving as proof of concept, the AI trade broadened. AMD rallied on expectations that its MI300 accelerator would capture share in the AI training market. Microsoft surged on its OpenAI partnership and Azure AI services. Google climbed on cloud AI demand. The week of June 12 saw NVDA close at $42.69 as the entire AI ecosystem caught a bid.
This phase was characterized by steady accumulation rather than explosive moves. NVDA traded in a relatively tight range between $37.36 and $43.99 over three weeks, with each weekly close building higher: $38.77, $42.69, $42.21. The stock was no longer a single-name story—it was the anchor of a sector-wide narrative. For holders, this was the comfortable phase: the thesis was working, the trend was intact, and every tech conference keynote seemed to validate the demand cycle.
Phase 3: The Second Surge (July 3 - July 24)
After a brief pause around the July 4 holiday, NVDA caught a second wind. The week of July 10 saw the stock close at $45.47 as a wave of analyst upgrades hit, with price targets being revised upward by 30-50% across the street. Reports of H100 shortages and multi-quarter lead times reinforced the scarcity narrative. Hyperscalers were publicly competing for GPU allocation, and the secondary market for H100s was pricing units well above list.
The peak came the week of July 24, when NVDA closed at $46.75—a 20% gain from the entry price. But the weekly candle told a cautionary tale: the stock had traded as high as $47.40 intraweek before pulling back. Momentum was intact, but the easy gains were getting harder. Valuation debates intensified, with bears arguing that the stock was pricing in years of perfect execution and bulls countering that the AI capex cycle was just beginning.
Phase 4: The August Correction (July 31 - August 14)
August brought the trade's sternest test. The week of July 31 saw NVDA decline from $46.75 to $44.68 as profit-taking accelerated across the tech sector. By August 7, the stock had dropped to $40.86—a 12.6% decline from the July 24 peak close of $46.75. The catalyst mix was toxic: growing concerns about U.S. tightening of chip export restrictions to China (NVIDIA had warned in August that expanded curbs could hurt American companies long-term), broader market weakness as the 10-year Treasury yield pushed higher, and simple mechanical profit-taking after a historic run.
This was the phase that separated conviction from momentum-chasing. The intraweek low of $40.31 during the week of August 14 represented a potential entry for those who believed the thesis was intact. The fundamental picture hadn't changed—AI demand was still accelerating, H100 shortages persisted, and NVIDIA's competitive position remained dominant. But the price action was testing whether holders had the stomach for double-digit drawdowns in a high-beta name.
Phase 5: The Pre-Earnings Recovery (August 14 - August 21)
The final two weeks of the trade brought a sharp recovery. With NVIDIA's Q2 FY2024 earnings report scheduled for August 23 (two days after exit), the market began positioning for another potential beat. NVDA rallied from $43.30 (week of August 14) to $46.02 (week of August 21), with the intraweek high of $50.27 representing the highest print of the entire trade period. Anticipation of another blowout quarter—and the fact that Q1's $11 billion guidance had seemed so conservative in hindsight—drew buyers back in.
The recovery erased most of the August correction and brought the stock to within striking distance of new highs. The intraweek high of $50.27 suggested that the market was already pricing in a strong Q2 report, setting up a risk/reward that favored taking profits before the binary event.
Exit
- Date: August 21, 2023
- Price: $46.02
- Context: Exiting the week before Q2 FY2024 earnings (August 23) meant capturing 18.15% of upside while avoiding the binary risk of the report. The stock had recovered strongly from its August lows, the intraweek high of $50.27 hinted at enthusiasm, and the 13.40 percentage points of alpha over SPY represented a meaningful outperformance. With the thesis validated—AI demand was real, NVDA was the undisputed beneficiary—the question was whether the next 20% of upside was worth the risk of a sell-the-news reaction on earnings.
Price Action
The trade in chart form
Price Chart with Entry/Exit
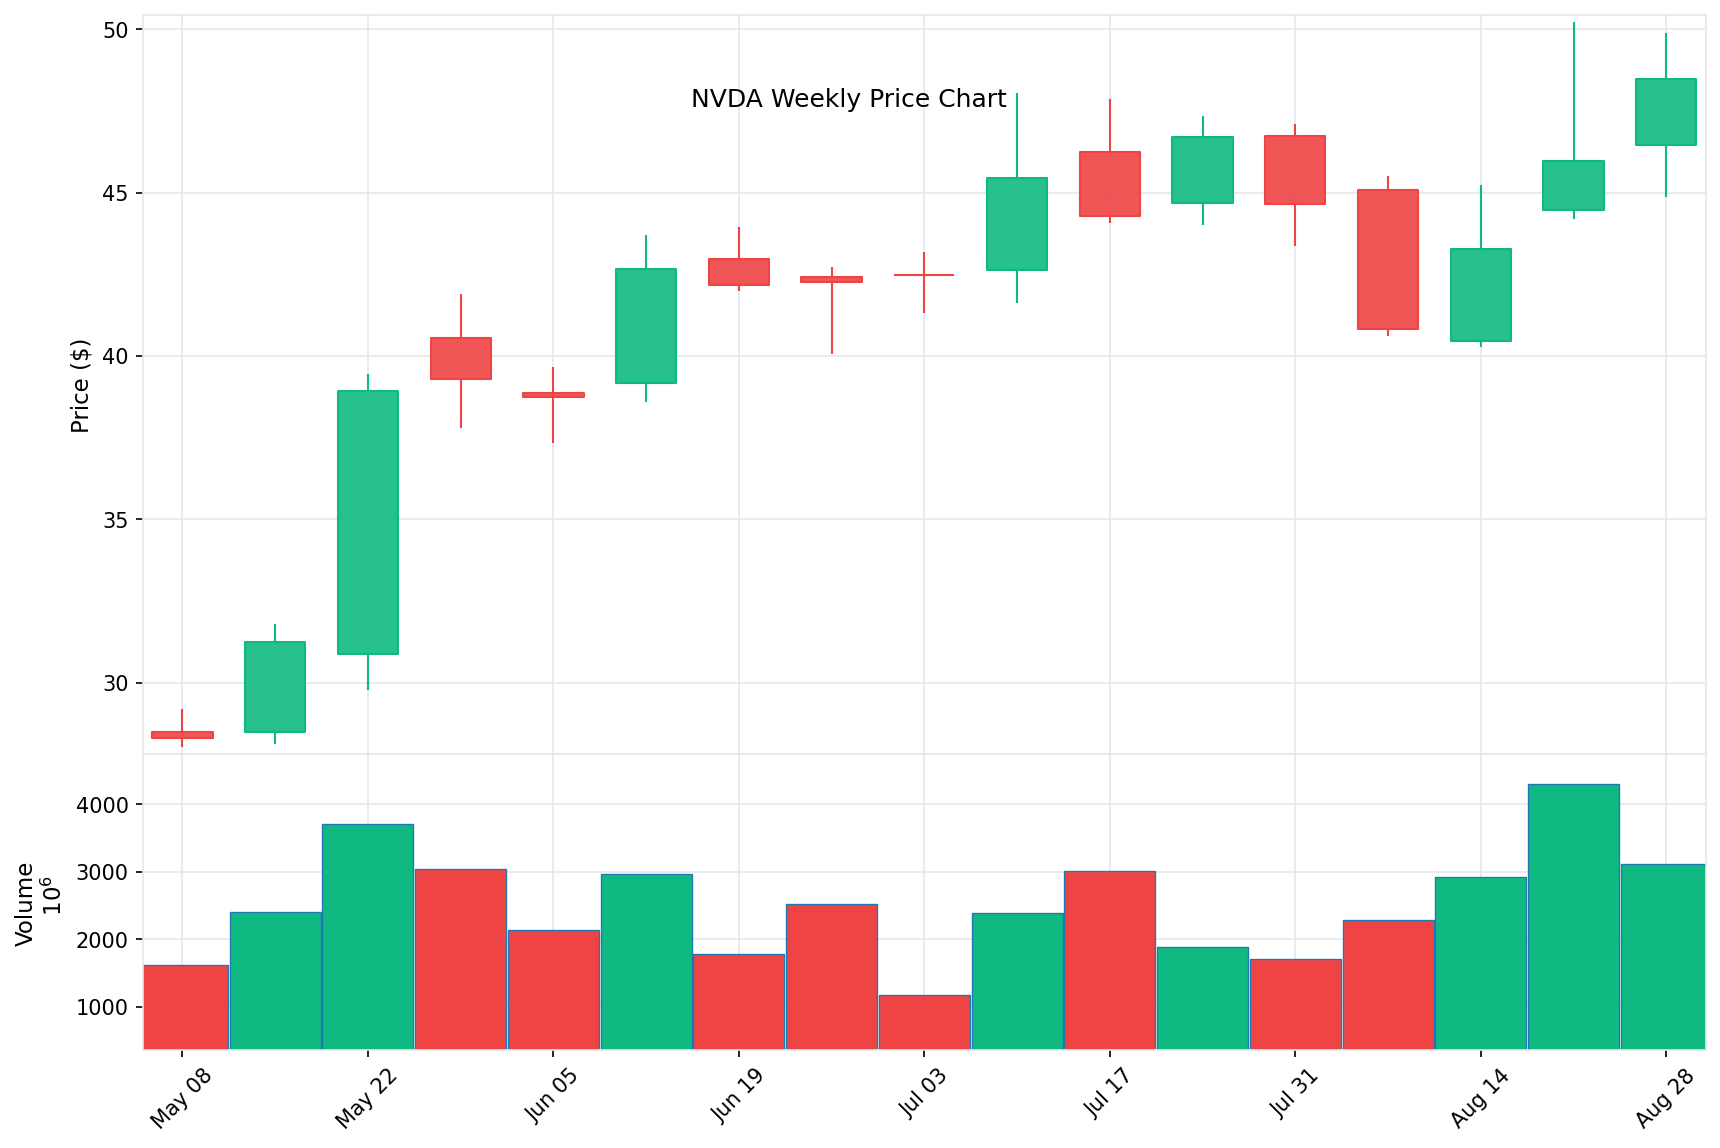
Weekly candlestick chart showing entry at $38.95 (green) and exit at $46.02 (blue). The massive earnings week candle—opening at $30.90 and closing at $38.95—dominates the chart, with subsequent price action oscillating between $40 and $47.
Relative Performance vs. SPY
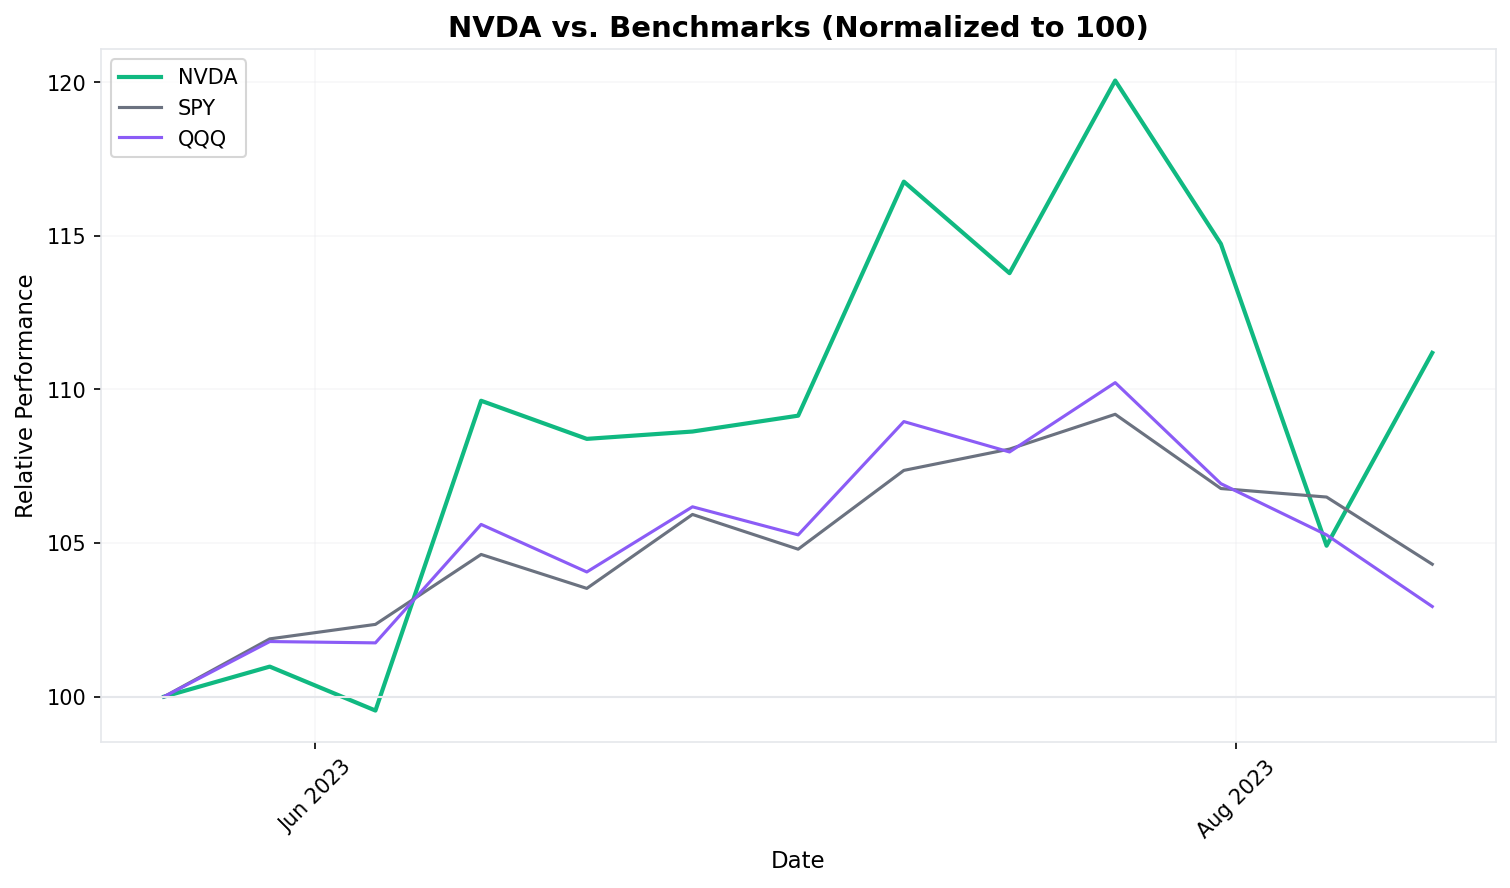
NVDA vs. SPY indexed to 100 at entry. NVDA reached 120 at its July peak while SPY topped out near 109. The gap narrowed during the August correction but NVDA maintained a commanding lead throughout.
Drawdown from Peak
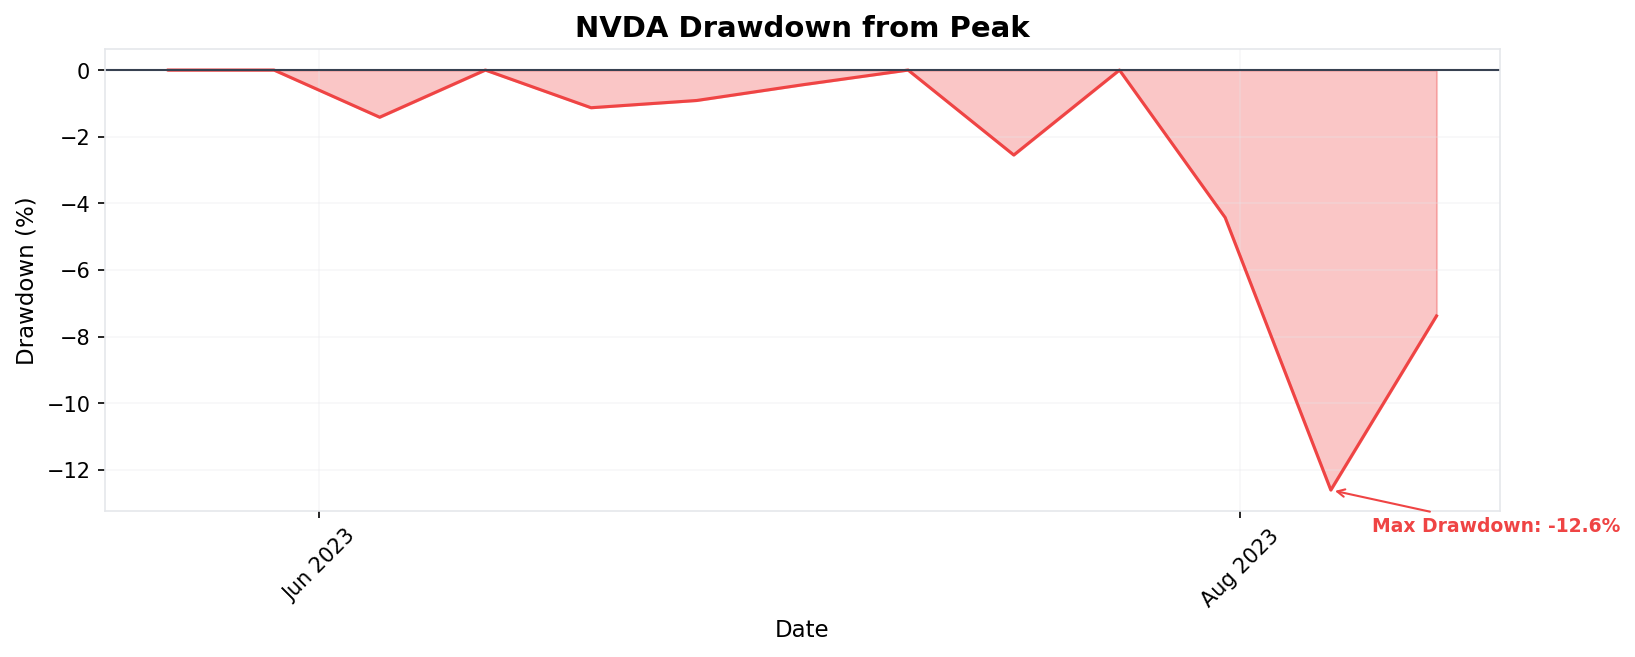
Peak drawdown of 12.6% from the July 24 close of $46.75 to the August 7 close of $40.86. The drawdown was sharp but brief, with the stock recovering to within pennies of new highs by exit.
Results
The final accounting
During the same May 22 to August 21, 2023 period:
S&P 500 (SPY): $420.02 to $439.97 = +4.75%
NVIDIA (NVDA): $38.95 to $46.02 = +18.15%
Alpha vs. SPY: +13.40 percentage points
NVDA delivered nearly four times the market's return over this three-month window. The outperformance was not evenly distributed—virtually all of the alpha was generated in the first three weeks following the earnings catalyst, with the remainder of the period spent consolidating, correcting, and recovering. SPY's modest 4.75% gain reflected a market that was broadly positive but lacked NVDA's singular catalyst.
The alpha is even more striking when you consider the risk taken. NVDA's 12.6% peak-to-trough drawdown was more than double SPY's worst pullback over the same period (SPY declined roughly 4.6% from its July 31 peak close of $456.92 to its August 14 close of $436.50). Investors earned a premium for bearing that volatility, but the ride was considerably rougher than the index.
Lessons
What the trade revealed
What Worked
-
The catalyst was unambiguous and massive. A $4 billion guidance beat—53% above consensus—is not a marginal surprise that can be explained away. It forced immediate model revisions across the entire sell side and triggered a re-rating that carried for months. When a catalyst is this large, the initial move is often just the beginning of the repricing, not the end of it.
-
The secular thesis had multiple confirmation points. This was not a one-company story. Microsoft's Azure AI revenue, Google's Bard launch, Meta's AI infrastructure investments, and AMD's accelerator roadmap all independently validated that AI capex spending was real and accelerating. Each confirmation point reduced the probability that NVDA's guidance was a one-time anomaly.
-
Supply scarcity supported pricing power. H100 GPU shortages meant NVIDIA had pricing power that typical semiconductor companies do not enjoy. Multi-quarter lead times and a secondary market trading above list price are hallmarks of genuine demand, not channel-stuffing or inventory build. This made it harder for bears to argue that the demand was a mirage.
-
The holding period captured the sweet spot of the narrative arc. Entering after the earnings catalyst and exiting before the next binary event (Q2 earnings on August 23) meant participating in the re-rating while avoiding the risk of a sell-the-news reaction. The three-month window was long enough to capture 18.15% but short enough to avoid the mean-reversion risk that comes with extended parabolic moves.
What Didn't Work
-
Entry required paying up after a 26% move. Buying at $38.95—the weekly close after a 26% earnings surge—meant the risk/reward was asymmetric from day one. The stock had already moved from $30.90 to $38.95 before the position was established. A pre-earnings entry (at, say, the $28-31 range available the week before) would have captured substantially more upside with a better margin of safety.
-
The August drawdown tested conviction without offering a clear signal. The 12.6% peak-to-trough decline from $46.75 to $40.86 was driven by a mix of macro headwinds (rising yields), geopolitical risk (China export curbs), and profit-taking—none of which invalidated the fundamental thesis. But in real time, distinguishing between "healthy pullback" and "beginning of a larger correction" was genuinely difficult, and the drawdown could have triggered a premature exit.
-
Geopolitical risk was real and unresolved. China represented a meaningful portion of NVIDIA's total addressable market, and U.S. export restrictions were tightening. NVIDIA's August 2023 warning that expanded curbs could hurt American companies was a signal that this risk had no clean resolution. The stock price incorporated AI optimism but may have underpriced the regulatory tail risk.
-
The exit missed the immediate upside. NVDA reported Q2 FY2024 earnings on August 23—two days after exit—and once again crushed expectations. The stock continued to rally, eventually reaching much higher prices in the following months. A rules-based exit at the end of the defined period left significant money on the table, though this is only visible in hindsight.
Key Takeaways
-
Generational catalysts create generational moves. NVIDIA's May 2023 earnings was not a normal beat-and-raise quarter. It was the moment the market realized that AI infrastructure spending would be measured in hundreds of billions of dollars, and that one company controlled the critical bottleneck. When you identify a catalyst of this magnitude, the typical valuation framework—"it's expensive, so it must be a sell"—breaks down. The stock went from $23 to $47 in three months because the addressable market expanded by an order of magnitude.
-
Consensus can be wrong by an enormous margin. Wall Street's Q2 revenue estimate of $7.2 billion versus NVDA's guidance of $11 billion was a 53% miss. This wasn't analysts being slightly cautious—it was the entire forecasting apparatus failing to grasp the speed and scale of the AI infrastructure buildout. When you see sell-side estimates clustering far below what bottom-up demand signals suggest, the consensus may be anchored to an outdated reality.
-
Volatility is the price of admission for high-conviction trades. A 12.6% drawdown in a stock that ultimately returned 18.15% is uncomfortable but not unusual for high-beta semiconductor names. The lesson is to size positions so that drawdowns of this magnitude do not force you out of the trade. If you cannot tolerate a 12% pullback, you have no business holding a stock that can move 26% in a single session.
-
Sympathy trades validate but also dilute the thesis. The broad AI rally—lifting AMD, MSFT, GOOGL, and dozens of other names—confirmed that the AI spending cycle was real. But it also meant that capital was flowing to the sector broadly, not just to the highest-quality name. When everything goes up together, it becomes harder to earn outsized alpha on the best idea because relative performance compresses.
-
Know when you are trading the narrative versus the numbers. For the first two weeks after earnings, NVDA's price action was driven by fundamental re-rating—analysts were literally rebuilding their models. By July and August, the stock was trading on narrative momentum, sentiment, and positioning. The shift from fundamental to narrative-driven price action is when risk management matters most, because narratives can reverse on a headline while fundamentals change slowly.
Sources
- NVIDIA Announces Financial Results for First Quarter Fiscal 2024 — NVIDIA Investor Relations, May 24, 2023
- Nvidia Ignites AI-Related Stock Rally After Blowout Forecast — Bloomberg, May 24, 2023
- Why Is Nvidia Stock Going Up? AI Brings Near Trillion-Dollar Valuation — Washington Post, May 25, 2023
- Nvidia Sounds Fresh Warning About Damage From China Export Rules — Bloomberg, August 24, 2023
- With New U.S. Export Restrictions, Can Nvidia Thrive Without China? — CNBC, October 17, 2023
- U.S. Curbs Export of More AI Chips, Including Nvidia H800, to China — CNBC, October 17, 2023
- Analysts Positive on NVIDIA's ChatGPT, AI Opportunity — Investing.com, 2023
- AI Hype Boomed to Start 2023. Earnings Reveal Gains Won't Appear Overnight — Yahoo Finance, 2023
- NVIDIA Q1 2024 Earnings: AI Demand Fuels Growth — SmartAsset, 2023
- What's Going On With Nvidia Stock and the Booming AI Market? — TechTarget, 2023
Disclosure: This case study is for educational purposes only and does not constitute investment advice. Past performance does not guarantee future results. All investments carry risk of loss.