Twenty-Two Days: The Fastest Crash in History and the Fed's Bazookas
The Setup
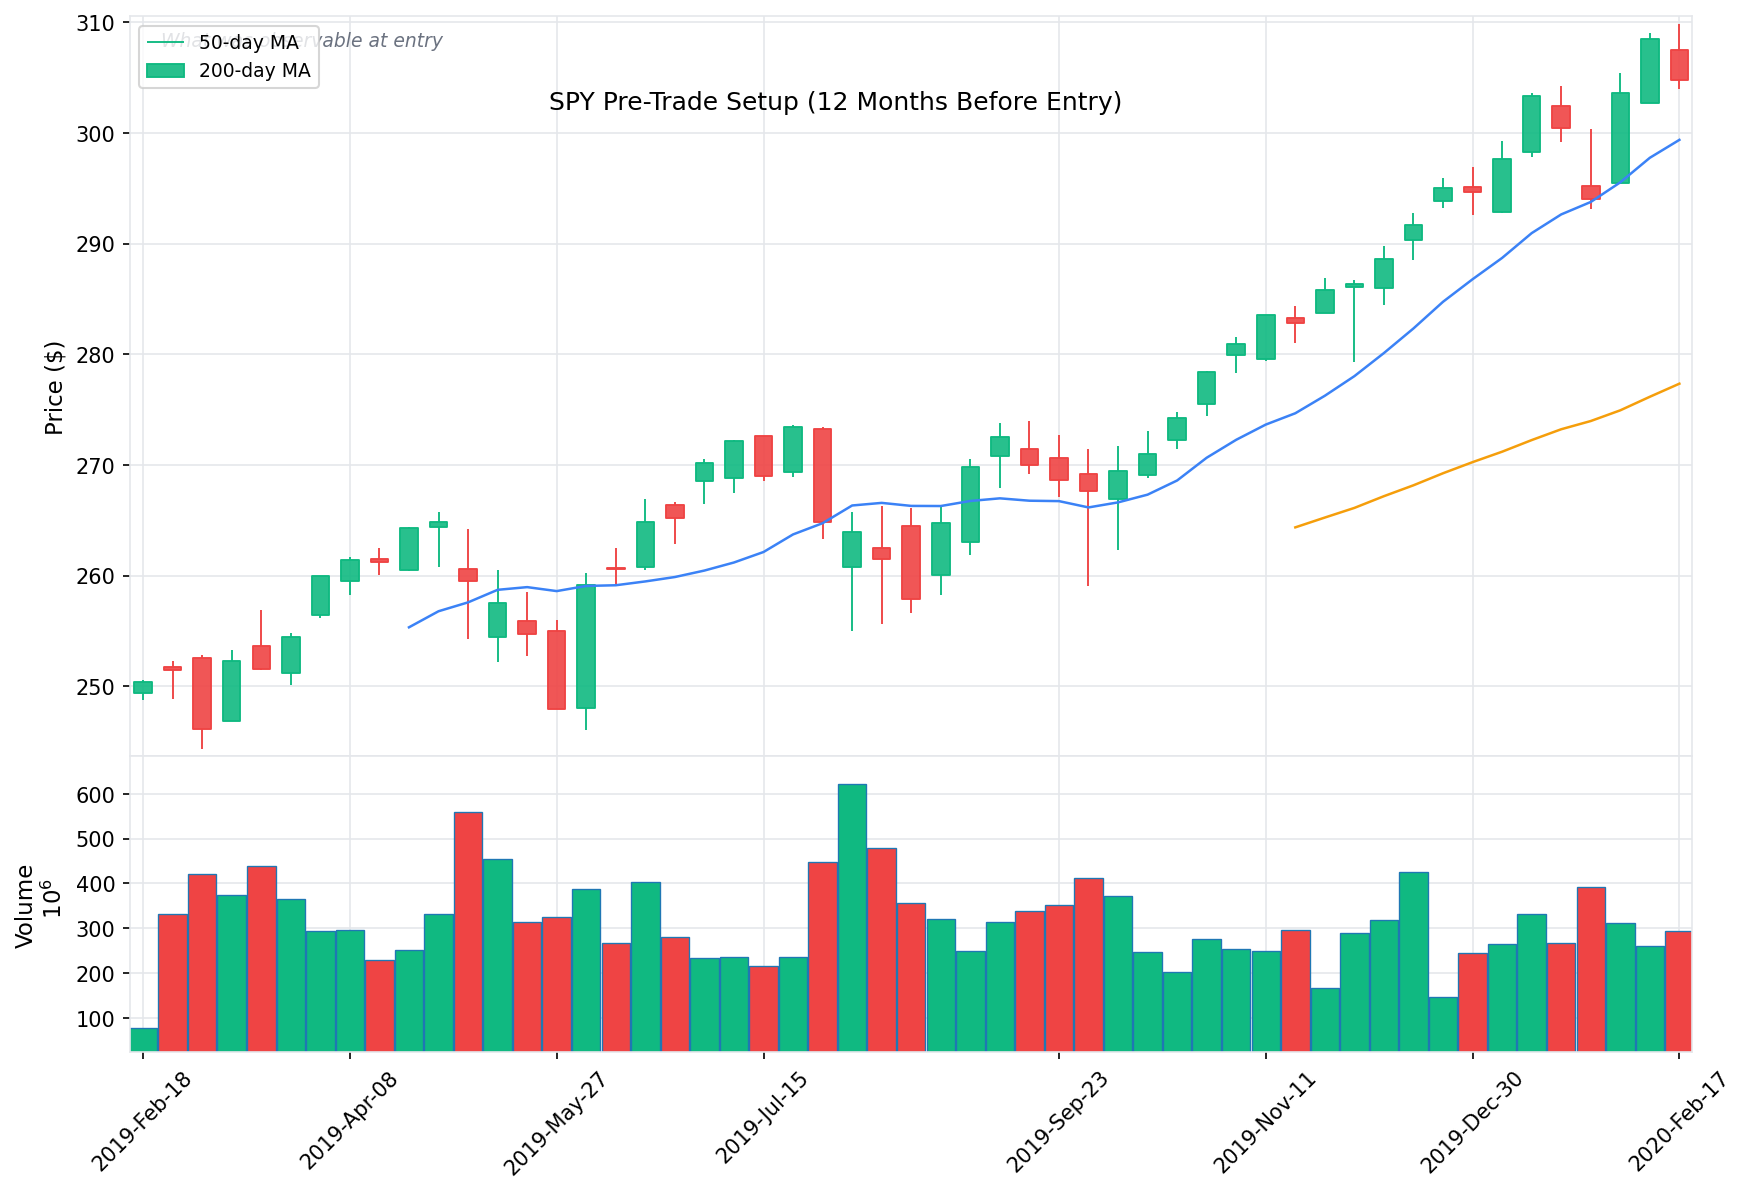
What the world looked like at entry
In February 2020, the S&P 500 was trading at all-time highs. The U.S. economy had been expanding for nearly eleven consecutive years, unemployment sat at 3.5%, and corporate earnings were solid. SPY closed the week of February 10 at $337.60, the highest weekly close in its history. The biggest worry on most investors' minds was whether the rally was getting a little stretched. Within twenty-two trading days, the index would lose more than 30% of its value — the fastest decline of that magnitude ever recorded, eclipsing the pace of the 1929 crash, the 1987 Black Monday collapse, and the 2008 financial crisis.
The catalyst was COVID-19. What had appeared to be a regional health issue in China became a global pandemic in a matter of weeks. Italy locked down. The WHO declared a pandemic on March 11. The NBA suspended its season. Travel bans multiplied. Circuit breakers tripped four times in ten days. The VIX — Wall Street's fear gauge — hit 82.69 on March 16, the highest closing level in its history. Oil futures went negative. It felt, for several weeks, like the financial system itself might not hold.
Then the Federal Reserve and Congress deployed a combined fiscal and monetary response of historically unprecedented scale. The Fed slashed rates to zero, launched unlimited quantitative easing on March 23 (the exact day of the market bottom), and created a suite of emergency lending facilities. Congress passed the $2.2 trillion CARES Act on March 27. SPY surged 29.6% off the intraweek low in under a month. This case study covers a nine-week holding period from February 17 to April 20 that produced a -15.15% return — but that headline number conceals a -31.4% drawdown and a furious recovery that rewrote the playbook on how fast markets can fall, how aggressively policy can respond, and how quickly sentiment can flip.
MACRO REGIME
- The U.S. was in its longest economic expansion on record, stretching back to June 2009
- Fed had cut rates three times in 2019 (to 1.50–1.75%), providing a tailwind to risk assets
- Unemployment at 3.5%, the lowest in 50 years
- U.S.-China Phase One trade deal signed on January 15, 2020, removing a major overhang
- SPY climbed steadily from $310.96 (week of Nov 18) to $337.60 (week of Feb 10) — an 8.6% advance in 12 weeks
WHAT WAS VISIBLE IN THE DATA
- SPY had not experienced a weekly close-to-close decline greater than 3% since May 2019
- The VIX spent most of January and February in the 12–15 range, reflecting extreme complacency
- Every weekly close from November through mid-February was higher than the one 4 weeks prior
- The lead-in OHLC data shows remarkably compressed weekly ranges — the biggest weekly high-to-low spread was only $8 (week of Jan 27)
EARLY COVID SIGNALS
- China locked down Wuhan (population 11 million) on January 23, 2020
- The WHO declared a Public Health Emergency of International Concern on January 30
- Italy reported its first major cluster on February 21 in Lombardy
- Markets largely shrugged off the virus through mid-February — SPY actually gained 1.6% the week of February 3-7 while Wuhan was in lockdown
- The disconnect between escalating pandemic news and rising stock prices was the single most important observable feature of the pre-entry environment
SENTIMENT
- Overwhelmingly bullish. "Buy the dip" had been the winning strategy for a decade
- Analyst consensus: virus would be contained to Asia with minimal economic impact
- Put/call ratios and sentiment surveys showed near-record optimism
- The phrase "this time is different" wasn't being said about risk — it was being said about upside
Entry Point
The thesis and the position
Anyone entering a broad market position in mid-February 2020 was implicitly making two bets: that the economy's decade-long expansion had more room to run, and that COVID-19 would remain a manageable regional event. The first bet had strong evidence — employment, consumer spending, and corporate earnings were all solid. The second bet was where the vulnerability hid.
The data already available by February 17 painted a concerning picture for anyone willing to look. China had locked down a city of 11 million people — an action with no modern precedent. Italy had emerged as a second front of infection. The virus's reproductive rate and hospitalization numbers from Wuhan suggested this was not a repeat of SARS or H1N1. But markets were pricing in containment, not pandemic. SPY opened the week of February 17 at $336.51, within 1% of its all-time high. The gap between what the epidemiological data was saying and what the market was pricing was as wide as it would ever get.
Before continuing: Consider what you would have done.
The Journey
From entry to exit
Key Events
| Date | Event | Category | SPY Reaction |
|---|---|---|---|
| Feb 17, 2020 | Entry at $333.48; COVID spreading beyond China | Entry | Starting point |
| Feb 21, 2020 | Italy reports cluster in Lombardy; South Korea cases surge | Pandemic | Selloff accelerates late in the week |
| Feb 24, 2020 | Monday opens with massive gap down; SPY drops to intraweek low of $285.54 | Pandemic | Weekly close $296.26 (-11.2% from entry) |
| Mar 3, 2020 | Fed emergency rate cut: 50bp (first since 2008) | Policy | Market briefly rallies, then sells off |
| Mar 9, 2020 | Black Monday I: S&P 500 falls 7%, circuit breaker triggered 4 minutes after open; Saudi-Russia oil price war begins | Macro/Pandemic | Weekly close $269.32 (-19.2% from entry) |
| Mar 11, 2020 | WHO declares COVID-19 a pandemic; Trump announces European travel ban; NBA suspends season | Pandemic | Cascade of shutdowns begins |
| Mar 12, 2020 | Black Thursday: Dow falls 9.9%, second circuit breaker in 4 days | Pandemic | Markets in freefall |
| Mar 15, 2020 | Fed cuts rates to zero (100bp emergency cut), launches $700B QE | Policy | Futures limit down on Sunday night despite rate cut |
| Mar 16, 2020 | Black Monday II: Dow falls 12.9%; third circuit breaker; VIX closes at all-time high of 82.69 | Pandemic/Policy | Weekly close $228.80 (-31.4% from entry) — lowest close of entire period |
| Mar 18, 2020 | Fourth circuit breaker triggered | Pandemic | Panic selling continues |
| Mar 23, 2020 | Fed announces unlimited QE — "whatever it takes"; SPY hits intraweek low of $218.26, then reverses | Policy | THE BOTTOM. Weekly close $253.42 |
| Mar 27, 2020 | CARES Act ($2.2 trillion) signed into law | Policy | Markets rally on unprecedented fiscal support |
| Apr 9, 2020 | Fed announces additional $2.3T in lending facilities | Policy | Rally broadens |
| Apr 20, 2020 | Exit week; WTI oil futures go negative (-$37.63/barrel) | Macro | Weekly close $282.97 (-15.15% from entry) |
How It Unfolded
Phase 1: The Crack (February 17 - February 28) The week of February 17 started like any other — SPY opened at $336.51 and the biggest concern on most trading desks was whether to buy the new iPhone. Then Italy reported a cluster of cases in Lombardy on February 21, and South Korea's confirmed count exploded. The market fell 2% on Thursday and Friday alone. But the real damage came the following week: Monday, February 24 opened with a gap down, and SPY posted an intraweek low of $285.54 — a stunning 15.8% below the all-time high in just five trading days. The weekly close of $296.26 represented an 11.2% loss from entry in a single week. The decade-long trend was shattered.
Phase 2: Freefall and Failed Interventions (March 2 - March 20) The Federal Reserve moved first on March 3 with an emergency 50 basis point rate cut, the first inter-meeting cut since 2008. Markets rallied briefly, then sold off harder. The message was clear: if the Fed was panicking, maybe investors should too. SPY closed that week at $297.46, basically flat — a dead cat bounce.
The following week unleashed genuine chaos. On Monday March 9, the S&P 500 fell 7% within four minutes of the open, triggering the first market-wide circuit breaker since 1997. Adding fuel: Saudi Arabia had launched an oil price war with Russia over the weekend. SPY's weekly close of $269.32 was already 19.2% below entry. Then came March 11 — in a single 72-hour span, the WHO declared a pandemic, Trump announced a European travel ban, and the NBA suspended its season. Circuit breakers triggered again on March 12.
On Sunday, March 15, the Fed went nuclear: an emergency 100bp cut to zero plus $700 billion in QE. Futures went limit down anyway. The market opened Monday morning and promptly fell 12.9%, triggering another circuit breaker. The VIX closed at 82.69 — the highest reading ever recorded, surpassing the 2008 financial crisis peak of 80.86. SPY closed the week at $228.80, down 31.4% from entry. A fourth circuit breaker was triggered on March 18. Four circuit breakers in ten days — prior to 2020, it had happened exactly once in history (1997).
Phase 3: The Bottom and the Bazooka (March 23 - March 27) March 23, 2020 is one of the most important single days in market history. Before the open, the Federal Reserve announced unlimited quantitative easing — it would buy Treasury bonds and mortgage-backed securities "in the amounts needed," with no cap. It also created new facilities to support corporate bond markets and commercial paper. SPY touched $218.26 intraday, the absolute bottom, then reversed. By the close of the week, it sat at $253.42 — a 16% rip off the lows in days. On March 27, President Trump signed the $2.2 trillion CARES Act, which included $1,200 stimulus checks, $600/week enhanced unemployment benefits, and the Paycheck Protection Program. The fiscal and monetary bazooka was fully loaded.
Phase 4: The Recovery Sprint (March 30 - April 20) The recovery was nearly as violent as the decline. SPY pulled back to $248.19 the week of March 30 — a brief retest that held above the March 23 lows — then launched higher. The week of April 6 produced a close of $278.20, a gain of 11.8% in one week. On April 9, the Fed announced an additional $2.3 trillion in lending facilities, pushing its total intervention to levels never before contemplated. By the exit week of April 20, SPY closed at $282.97 — still 15.15% below entry, but a remarkable 29.6% above the $218.26 intraweek low of just four weeks earlier. Notably, the exit day coincided with one of the most surreal moments in financial history: WTI crude oil futures for May delivery went negative, settling at -$37.63 per barrel, as storage capacity ran out and contract holders paid buyers to take their oil.
Exit
- Date: April 20, 2020
- Price: $282.97
- Context: SPY had recovered roughly half of its peak-to-trough decline in under a month. The Fed had committed to unlimited QE, the CARES Act was law, and the worst of the liquidity crisis had passed. But the pandemic itself was far from over — the U.S. was logging 30,000+ new cases per day, most states were still locked down, and 22 million Americans had filed for unemployment in four weeks. The exit captured the initial recovery but not the full V-shape that would carry SPY back to all-time highs by August. Oil going negative on the exit date was a reminder that the real economy remained deeply broken even as financial markets were healing.
Price Action
The trade in chart form
Price Chart with Entry/Exit
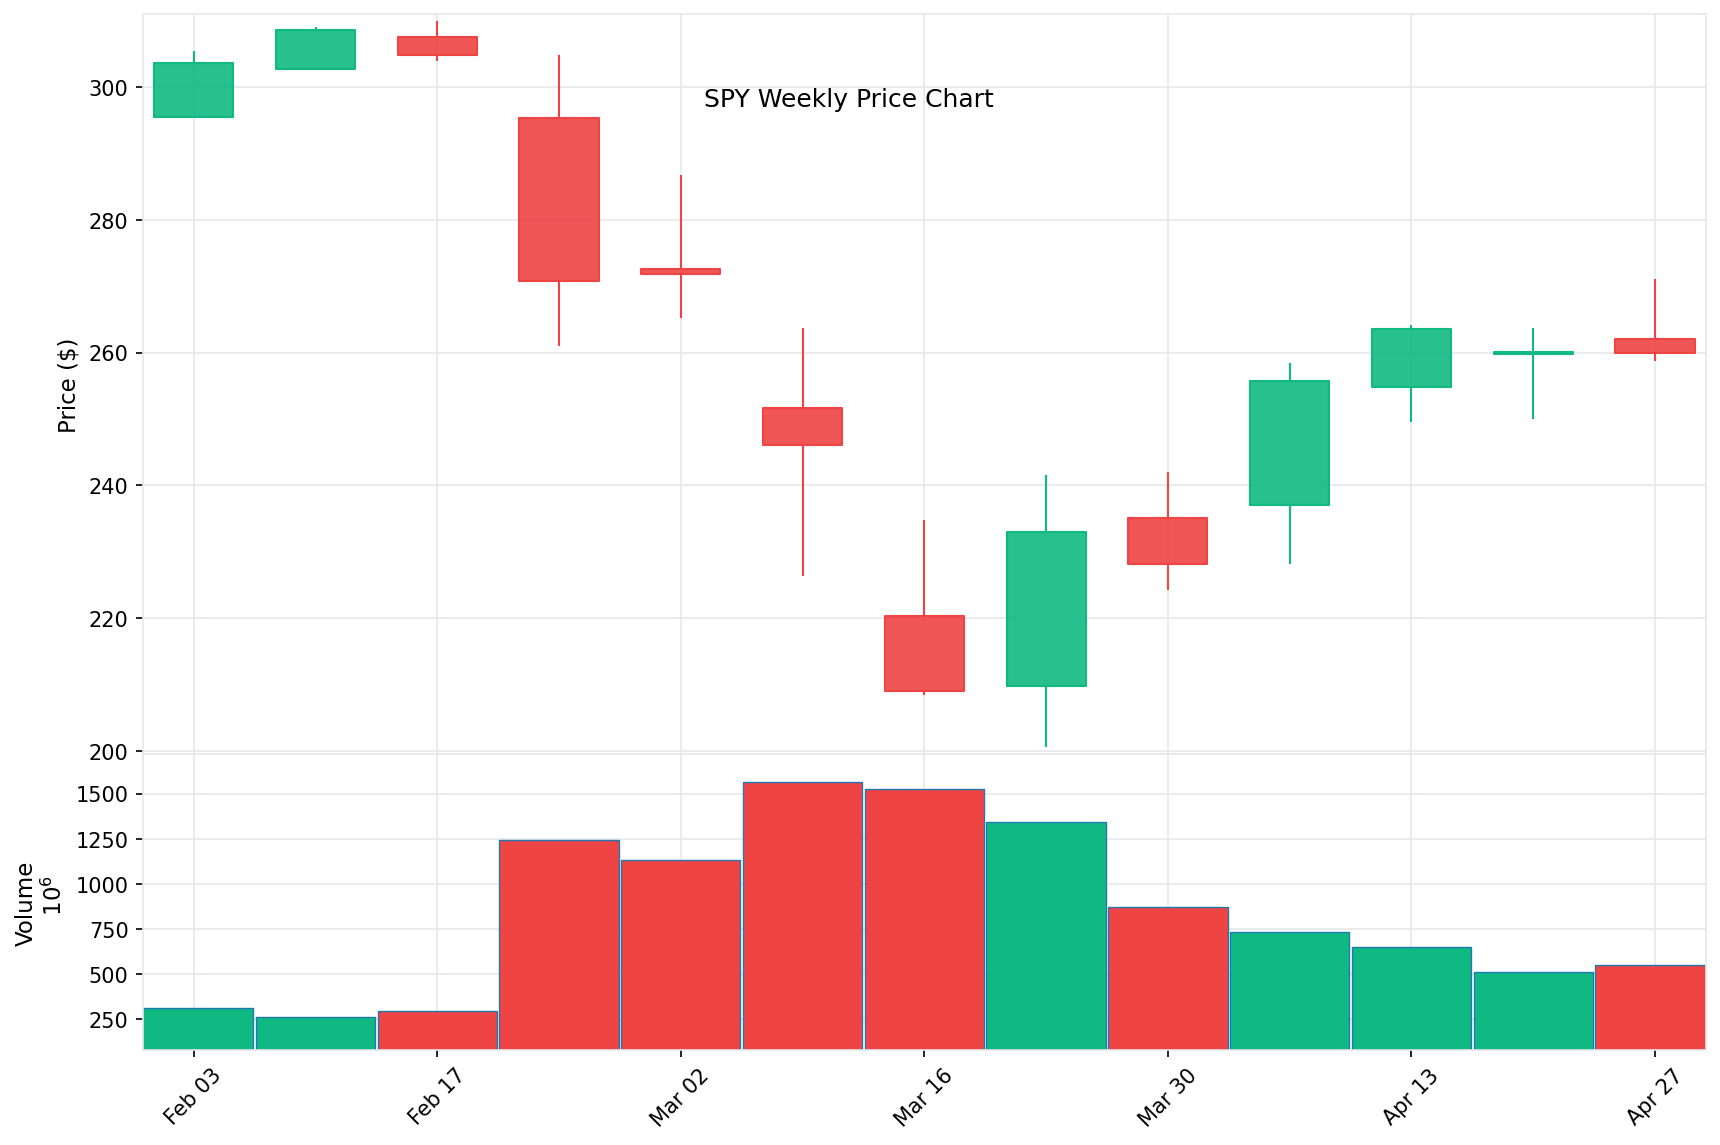
Weekly candlestick chart showing entry at $333.48 and exit at $282.97. The V-shaped pattern is unmistakable: five weeks of cascading declines followed by four weeks of sharp recovery. The March 23 intraweek low of $218.26 marks the exact bottom.
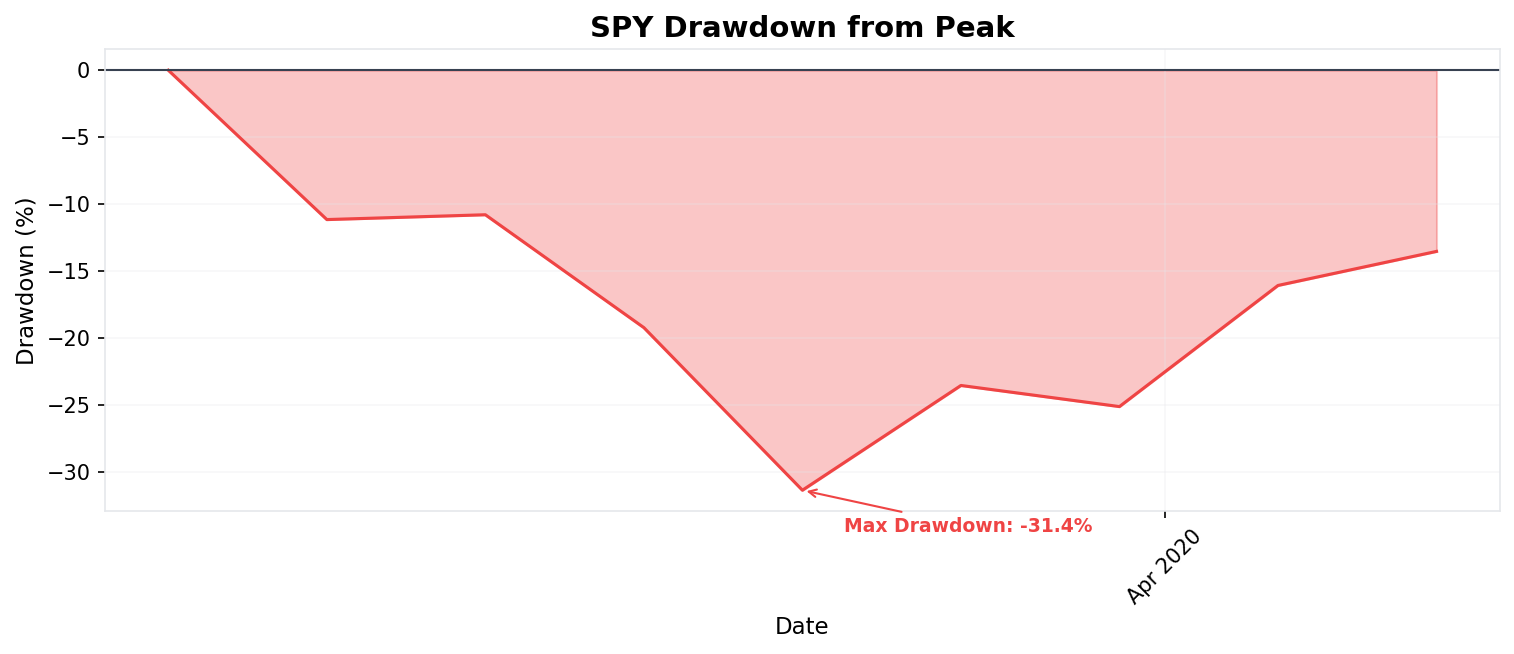
Drawdown from Entry
Drawdown from entry price showing the plunge to -31.4% (close basis) by March 16 and the partial recovery to -15.15% by exit. The steepness of the decline — concentrated in just three weeks — is what made this crash historically unique.
Recovery from Bottom
From the $218.26 intraweek low on March 23 to the $282.97 exit on April 20, SPY gained 29.6% in less than a month. The recovery was directly correlated with the scale of policy intervention: unlimited QE (March 23), CARES Act (March 27), and additional Fed lending facilities (April 9).
Results
The final accounting
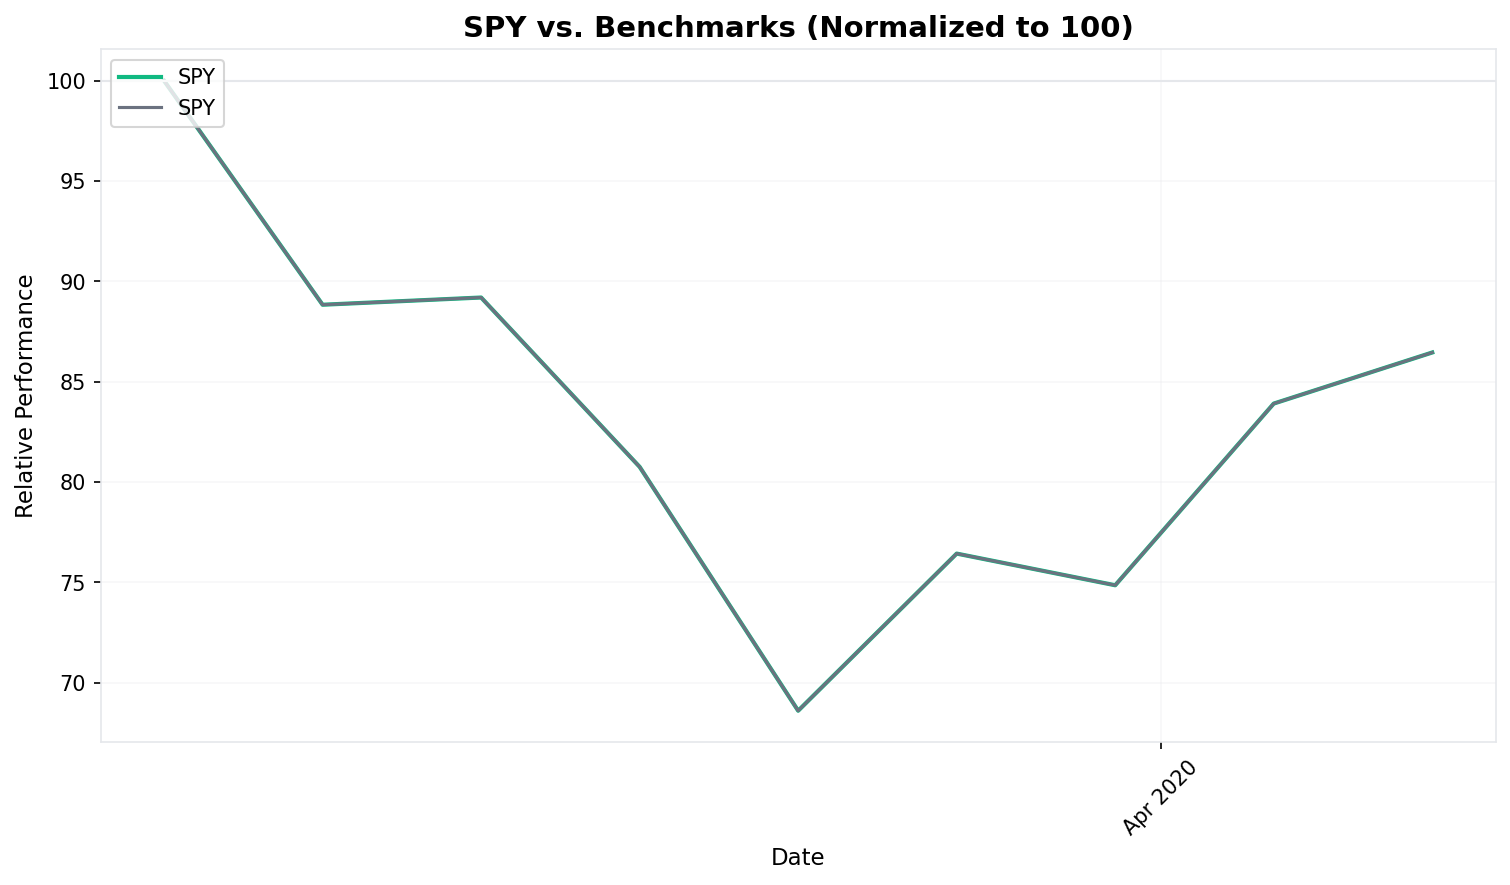
Since SPY *is* the benchmark, relative performance requires a different lens. Here the comparison isn't stock-versus-index but rather the speed and severity of this crash against history:
Speed of Decline:
2020 COVID crash: 22 trading days to fall 30% from the all-time high — the fastest ever recorded
1929 Great Crash: The second-fastest, but took considerably longer to reach -30%
1987 Black Monday: The largest single-day decline (S&P 500 fell 20.5% on October 19) but the cumulative drop was shallower
2008 Financial Crisis: The peak-to-trough decline was larger (56.8%) but unfolded over 17 months, not 22 days
Asset Comparison (Feb 17 - Apr 20, 2020):
QQQ (Nasdaq 100): Fell less and recovered faster, closing the period at roughly -8%, outperforming SPY by 7 percentage points, as tech companies were relative winners in a stay-at-home economy
TLT (Long-term Treasuries): Gained approximately 18% over the same period as rates collapsed to zero, demonstrating the hedge value of bonds during equity panics
GLD (Gold): Rose roughly 7%, serving as a modest safe haven but lagging Treasuries
The divergence between SPY and QQQ during this period foreshadowed the tech-led recovery that would dominate the rest of 2020. The pandemic accelerated digital adoption by years, rewarding Nasdaq-heavy portfolios and punishing value-oriented and energy-heavy exposures.
Lessons
What the trade revealed
What Worked
-
The policy response was historically unprecedented — and it worked immediately. The combination of unlimited QE, zero interest rates, $2.2 trillion in fiscal stimulus, and multiple emergency lending facilities represented the largest coordinated policy intervention in history. The market bottomed on March 23 — the same day the Fed announced unlimited QE. Policy overwhelmed panic in real time. For anyone who recognized the pattern and bought the policy response, the returns were extraordinary.
-
Circuit breakers functioned as designed. The four circuit breakers triggered between March 9 and March 18 forced cooling-off periods during the most intense panic. While they didn't prevent the decline, they slowed it enough to prevent a complete market dislocation. The NYSE's systems handled record volume without technical failure — a quiet success that prevented the crash from becoming a crisis of market infrastructure.
-
The V-shaped recovery rewarded staying invested. An investor who held through the -31.4% drawdown captured the 29.6% recovery from the bottom. Selling at the low — as many did — locked in losses that the market erased within weeks. The speed of the recovery vindicated the oldest piece of market wisdom: time in the market beats timing the market, at least when the monetary printing press is running at full speed.
-
Diversification into bonds and tech provided genuine protection. Long-term Treasuries (TLT) gained roughly 18% during the same period SPY fell 15.15%. QQQ outperformed SPY by about 7 percentage points. A portfolio that held any meaningful allocation to bonds or tech-heavy growth stocks experienced a dramatically different drawdown than a pure SPY holder.
What Didn't Work
-
The "buy the dip" reflex that worked for a decade failed catastrophically in the early stages. Investors who bought the initial 5% dip in late February watched their positions fall another 25%. The first Fed rate cut on March 3 looked like a traditional dip-buying signal — and buyers who acted on it were underwater within 48 hours. In a genuine panic, the first dip is rarely the last.
-
Traditional valuation metrics were irrelevant during the crash. The S&P 500's P/E ratio, dividend yield, and earnings estimates all became meaningless when the question shifted from "what is this company worth?" to "will this company still exist in six months?" The market was pricing in an economic shutdown of unknown duration, and no spreadsheet model had a cell for "global pandemic forces 330 million Americans to stay home."
-
The emergency rate cut on March 15 spooked markets rather than calming them. When the Fed cut 100 basis points to zero on a Sunday night — an action so extraordinary it had never been attempted — futures went limit down. The unprecedented nature of the move signaled to markets that the Fed saw something terrifying in the data. Central bank panic can be contagious rather than reassuring.
-
Risk models built on historical volatility were useless. The VIX's closing high of 82.69 on March 16 exceeded every prior reading in its history. Value-at-Risk models calibrated to pre-COVID volatility wildly understated the actual risk. Options strategies, levered ETFs, and systematic strategies that relied on recent volatility estimates were blown up by a move that their models said should happen once in several thousand years.
Key Takeaways
-
Exogenous shocks don't respect trend lines. The S&P 500 had been in an uptrend for eleven years. Every technical indicator said "buy." None of it mattered when a novel virus shut down the global economy. The most dangerous market environments are the ones where the biggest risk isn't on anyone's watchlist. In late January 2020, the consensus was that the virus was "China's problem." Twenty-two trading days later, it was the world's problem and the market had lost a third of its value.
-
Policy response speed matters more than crash severity. The 2008 crisis saw a larger total decline (56.8%) but took 17 months to play out, partly because the policy response was slow, incremental, and mired in political debate. In 2020, the Fed went from the first rate cut to unlimited QE in twenty days. Congress passed $2.2 trillion in stimulus in under two weeks. The speed of the policy response matched the speed of the crash, which is why the recovery was V-shaped rather than U-shaped or L-shaped.
-
The relationship between the market bottom and the economic bottom was completely inverted. SPY bottomed on March 23. Unemployment claims peaked at 6.9 million in a single week in late March. The economy wouldn't begin reopening for months. The market was pricing in future recovery while the present was still deteriorating — a reminder that stocks are not the economy and markets look forward, not backward.
-
Liquidity crises and solvency crises require different responses — and 2020 was a liquidity crisis. The companies in the S&P 500 were, for the most part, healthy businesses facing a temporary external shock. This was not 2008, where the financial system's balance sheets were fundamentally impaired. Because the underlying solvency of most businesses was intact, adding liquidity (via QE and lending facilities) and bridging income (via stimulus checks and PPP loans) could actually solve the problem. Recognizing the type of crisis you're in is essential to predicting the policy response and the recovery shape.
-
The day oil went negative was the day the exit made sense. WTI crude settling at -$37.63 on April 20 demonstrated that while financial markets were healing, the real economy remained deeply dislocated. Oil storage was full, demand had collapsed, and physical commodity markets were breaking in ways futures traders had never contemplated. The exit at $282.97 captured the policy-driven recovery while acknowledging that the pandemic's economic damage was far from over. SPY would not reclaim $333 until late May — five more weeks of choppy trading that tested every holder's conviction.
Sources
- This Was the Fastest 30% Stock Market Decline Ever — CNBC, March 23, 2020
- Wall Street's Fear Gauge Closes at Highest Level Ever — CNBC, March 16, 2020
- Federal Reserve Cuts Rates to Zero and Launches Massive QE Program — CNBC, March 15, 2020
- Fed Signals Unlimited QE, Adds Aid for Companies and Municipalities — Bloomberg, March 23, 2020
- What Did the Fed Do in Response to the COVID-19 Crisis? — Brookings Institution
- Trump Signs $2 Trillion Coronavirus Relief Bill — CNBC, March 27, 2020
- 2020 Stock Market Crash — Wikipedia
- Oil Prices: Futures Contract Goes Negative in Bizarre Move — CNBC, April 20, 2020
- Low Liquidity and Limited Storage Pushed WTI Crude Below Zero — U.S. Energy Information Administration
- Timeline: The Federal Reserve Responds to the Threat of Coronavirus — American Action Forum
- Assessing NYSE Model Performance During 2020 Crash — NYSE
Disclosure: This case study is for educational purposes only and does not constitute investment advice. Past performance does not guarantee future results. All investments carry risk of loss.