Country Risk Assessment Framework
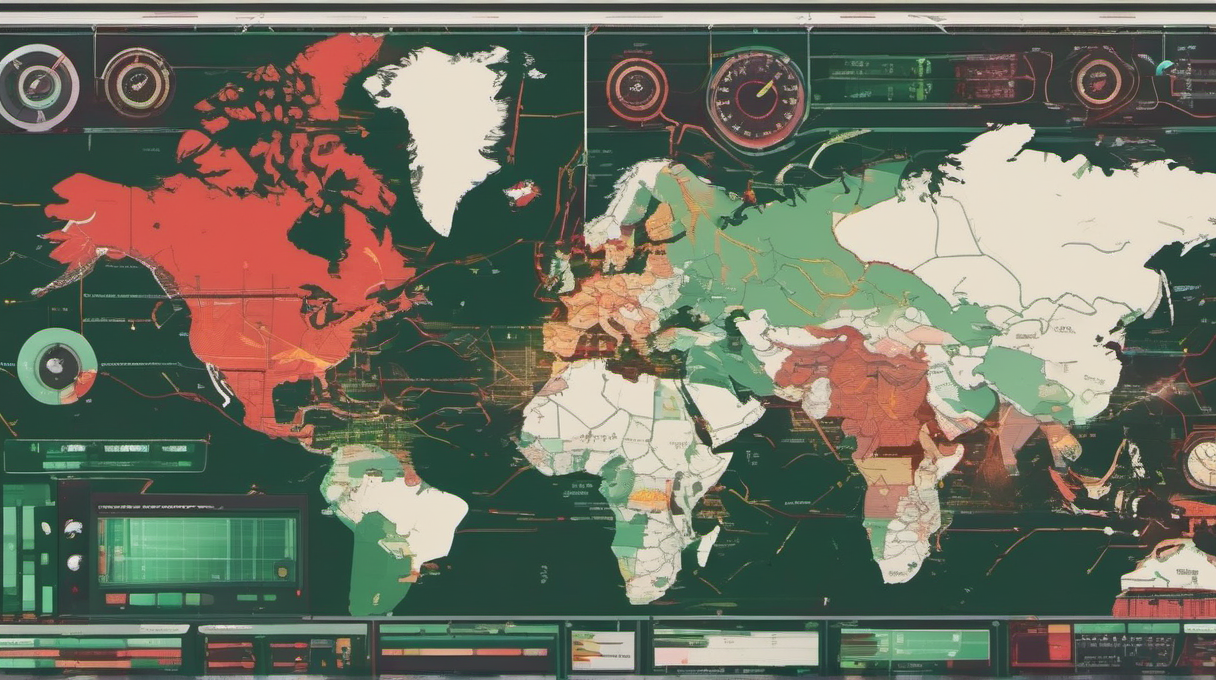
Country risk is the single biggest variable most emerging market investors underestimate—and the one that destroys portfolios fastest when it turns. Sri Lanka's 2022 default wiped out bondholders who ignored reserves dropping below $2 billion, fiscal deficits exceeding 10% of GDP, and a currency in freefall. Between 2020 and 2023, 15 sovereign defaults hit investors who lacked a systematic way to see the warning signs. The practical antidote isn't avoiding emerging markets entirely (EM growth is projected at 4%+ annually through 2026, roughly triple the developed-market pace). It's building a structured scorecard that flags deterioration before crisis—and enforcing position-size rules tied to that score.
Why Most Investors Get Country Risk Wrong (The Core Problem)
Here's what goes wrong. You find an attractive company in an emerging market—strong margins, reasonable valuation, growing revenue. You buy. Then the sovereign defaults, the currency drops 35%+ against the dollar (the average pre-default devaluation over three years, per S&P Global research), capital controls freeze your position, and your company-level analysis becomes irrelevant.
The point is: country risk isn't a background factor—it's the dominant risk in EM investing. Currency devaluations, capital controls, political instability, and sovereign default impair returns regardless of how good your stock picking is. The 1997 Asian financial crisis, Argentina's serial defaults, and Sri Lanka's 2022 collapse all demonstrate the same pattern: country-level risks overwhelm bottom-up security selection.
A structured framework gives you three things: consistent comparison across countries, early detection of deteriorating conditions, and rules-based position sizing that take emotion out of allocation decisions.
The Five Pillars of Country Risk (What Actually Drives Defaults)
Country risk breaks down into five measurable categories. Think of them as a causal chain:
Macro instability → Fiscal deterioration → External vulnerability → Political/governance breakdown → Market illiquidity
Each pillar feeds the next. A country rarely defaults because of one factor in isolation—it's the compounding of weaknesses across multiple pillars that creates crisis. Your job is to score each one, weight them, and watch for the pillar that's deteriorating fastest.
Pillar 1: Macro Stability Indicators (Your Economic Foundation)
Macroeconomic stability is the floor everything else rests on. When this pillar cracks, every other pillar follows—fiscal balances blow out, external accounts deteriorate, and political pressure mounts. Three metrics matter most.
Real GDP growth needs context, not just a number. Growth of 4-6% is typical for healthy emerging markets, but growth driven by credit expansion or unsustainable fiscal stimulus (Sri Lanka pre-2022) is far more dangerous than growth driven by exports or productivity gains. If growth exceeds 7% and relies on a single sector, that's a red flag, not a celebration.
Inflation tells you whether the central bank is credible. Single-digit inflation is manageable. Double-digit inflation signals monetary policy is losing the fight. Triple-digit inflation (Argentina hit 211% in 2023) means the monetary system is breaking down. The signal worth remembering: watch the trend, not just the level. Rising inflation of 5+ percentage points annually often precedes currency pressure and forced policy tightening.
Foreign exchange reserves determine whether a country can defend its currency and meet external obligations. Sri Lanka's reserves dropped to just $1.9 billion before default—barely one month of import coverage, with much of it locked in a Chinese renminbi swap that wasn't practically usable.
| Indicator | Low Risk | Watch Closely | Red Flag |
|---|---|---|---|
| Real GDP growth | 3-6%, diversified | Below 3% or above 7%, volatile | Negative or single-sector dependent |
| Annual inflation | Below 5% | 5-15% or rising fast | Above 15% or accelerating |
| Reserve import coverage | 6+ months | 3-6 months | Below 3 months |
Why this matters: reserves below three months of import coverage have preceded nearly every major EM currency crisis in the last three decades. This is your single most reliable early-warning metric.
Pillar 2: Fiscal and Debt Position (The Slow-Burning Fuse)
Fiscal health determines whether a government can service its debts without resorting to money-printing or default. Emerging markets face crisis at lower debt levels than developed markets because they have shallower domestic capital markets and higher currency risk.
Budget deficits above 3-4% of GDP persistently are the slow-burning fuse. Sri Lanka's 2019 tax cuts slashed revenue by 2% of GDP in a single policy decision—accelerating a fiscal trajectory that was already unsustainable. You're looking for the trend: is the deficit widening or narrowing?
Government debt-to-GDP above 60-70% in an emerging market demands serious scrutiny. But composition matters as much as level. Foreign-currency debt creates exchange-rate vulnerability (when the currency drops, the debt burden explodes in local terms). Short-term debt creates rollover risk (if investors refuse to refinance, you get a sudden stop). S&P Global's research shows that defaulting sovereigns spent, on average, nearly 20% of government revenues on interest payments in the year before default.
External debt relative to exports reveals repayment capacity. External debt exceeding 150% of annual exports is where sustainability concerns begin—the country simply can't earn enough foreign currency to service what it owes. As of 2024, external debt burdens across low- and middle-income countries reached a record $8.9 trillion, with interest payments climbing to $415 billion—both all-time highs. The structural pressure is real and growing.
The test: can the country service its debt without relying on continuous access to international capital markets? If the answer is no, you're one sentiment shift away from crisis.
Pillar 3: External Balance (Where Sudden Stops Start)
External accounts tell you how dependent a country is on foreign capital inflows—and therefore how vulnerable it is to a "sudden stop" when global risk appetite shifts.
Current account deficits exceeding 4-5% of GDP mean the country needs constant capital inflows to finance the gap. When those inflows reverse (as they did across emerging markets during the 2013 "taper tantrum" and the 2022 Fed hiking cycle), the currency drops, reserves drain, and the government faces impossible choices.
Net international investment position captures accumulated foreign assets minus liabilities. S&P Global found that this measure weakened by an average of 30 percentage points to -106% of GDP over the three years before sovereign defaults. That deterioration—not the absolute level—is your signal.
The practical antidote: track the direction of external balances quarterly. A current account deficit that's narrowing is very different from one that's widening, even if the absolute number looks similar. Countries with stronger fundamentals—higher shares of local-currency debt and more diverse investor bases—exhibit more stable bond yields and market liquidity during stress. That structural resilience is what separates an Indonesia (which navigated the 2022 tightening cycle relatively well) from a Sri Lanka (which didn't survive it).
| Indicator | Low Risk | Watch Closely | Red Flag |
|---|---|---|---|
| Current account (% GDP) | Better than -2% | -2% to -5% | Worse than -5% |
| External debt (% GDP) | Below 30% | 30-50% | Above 50% |
| External debt (% exports) | Below 100% | 100-200% | Above 200% |
Pillar 4: Political and Governance Risk (The Hardest to Quantify)
Political risk is where most frameworks break down—because it requires judgment, not just data. The ICRG (International Country Risk Guide) has been scoring political risk across 141 countries since 1980, using 12 variables including government stability, corruption, law and order, and ethnic tensions. Their political risk index runs on a 100-point scale, with subjective analyst assessments ensuring consistency across countries and time.
Three governance factors matter most for investors.
Rule of law and property rights determine whether your investment is actually yours. World Bank Governance Indicators provide standardized percentile rankings. Countries below the 30th percentile on rule of law have materially higher expropriation and contract-enforcement risk (the kind that makes your legal rights meaningless in practice).
Corruption affects operating costs and predictability. Transparency International's Corruption Perceptions Index scores countries from 0 to 100—scores below 30 indicate systemic corruption that creates unpredictable costs for businesses operating in that jurisdiction.
Geopolitical positioning has become increasingly important. Countries facing US or EU sanctions face severe investment constraints (effectively uninvestable for most institutional portfolios). But even proximity to conflict zones or deteriorating relationships with major trading partners can disrupt trade flows and capital access. The Allianz Country Risk Atlas noted that geopolitical tensions, trade-war risks from rising protectionism, and civil unrest intensified significantly through late 2024—making this pillar more relevant now than at any point in the past decade.
What the data confirms: political risk doesn't usually appear suddenly. Sri Lanka's governance problems—the 2019 tax cuts, the fertilizer ban, the rigid exchange rate—were visible policy choices made years before default. The signals were there for anyone with a framework to track them.
Pillar 5: Market Liquidity (Your Exit Door)
Liquidity determines whether you can get out when you need to—which is precisely when everyone else is trying to leave too.
Equity market capitalization relative to GDP above 50% indicates a reasonably developed market. Below 25%, you're dealing with thin markets where price impact on entry and exit can be enormous (often 2-5% per trade in stressed conditions).
Capital account openness is critical. Some countries have imposed capital controls during crises—Malaysia in 1998, Iceland in 2008, Nigeria periodically. Historical patterns of control imposition are your best predictor of future restrictions. If a country has used capital controls before, assume they'll use them again under stress.
Foreign ownership restrictions range from none (fully open markets like South Korea) to significant (markets like China's A-shares, where access requires specific programs like Stock Connect). These restrictions affect not just entry but—more importantly—your ability to exit during stress. Settlement and custody infrastructure adds another layer of operational risk—some markets still have T+3 or longer settlement cycles, and custodial arrangements may expose you to counterparty risk you haven't priced in.
Average daily trading volume is your practical liquidity gauge. Markets with volume above $500 million daily allow institutional-scale entry and exit. Below $100 million, even a modest portfolio rebalance can move prices against you (and in a crisis, those thin markets become essentially untradeable).
Why this matters: the best analysis in the world is worthless if you can't act on it. Always know your exit before you enter.
Building Your Composite Score (The Weighted Scorecard)
Assign scores from 1 (low risk) to 5 (high risk) for each pillar, then weight them:
| Pillar | Weight | Rationale |
|---|---|---|
| Macro stability | 25% | Foundation; affects everything else |
| Fiscal position | 20% | Determines debt sustainability |
| External balance | 20% | Drives sudden-stop vulnerability |
| Political/governance | 20% | Shapes policy response to shocks |
| Market liquidity | 15% | Determines execution and exit capability |
Score interpretation and position-sizing rules:
- 1.0-2.0 (Low Risk): Full allocation appropriate—these are your core EM holdings
- 2.0-3.0 (Moderate Risk): Standard allocation with quarterly monitoring
- 3.0-4.0 (Elevated Risk): Reduce allocation by 50% and monitor monthly
- 4.0-5.0 (High Risk): Minimal or zero allocation—the risk-reward doesn't compensate you
The point is: the score itself matters less than having consistent rules that force you to reduce exposure when conditions deteriorate. Most investors hold too long because they anchor to their original thesis (or their cost basis) rather than updating for new information. In 2024, global country risk actually improved broadly—48 economies were upgraded versus only 5 downgrades, with Latin America and Emerging Europe leading the upgrades. That kind of environment makes it tempting to relax discipline. Don't. The countries that defaulted in 2020-2023 also looked manageable a year or two before crisis hit.
Early Warning Triggers (When to Reassess Immediately)
Don't wait for your quarterly review when any of these occur:
- Reserve decline exceeding 10% in a single quarter (Sri Lanka's reserves dropped from $7.5 billion to $1.9 billion over roughly 18 months)
- Inflation acceleration of 5+ percentage points annually
- Currency depreciation exceeding 15% against USD (average pre-default devaluation is 35%+ over three years)
- Sovereign credit rating downgrade by any major agency
- Interest payments exceeding 15% of government revenue (defaulting sovereigns averaged nearly 20%)
The practical antidote: set these as automated alerts. If you're monitoring 10-15 emerging markets, you can't rely on memory to catch deterioration across all of them. Build a simple spreadsheet with threshold triggers that turn red automatically.
Country Risk Assessment Checklist (Tiered)
Essential (high ROI)
These four steps prevent 80% of EM allocation mistakes:
- Score each country across all five pillars quarterly using publicly available data (IMF, World Bank, central bank reserves reports)
- Set hard position-size limits tied to composite score—no exceptions for "this time is different"
- Monitor reserve import coverage monthly—below 3 months triggers immediate review
- Track interest-payments-to-revenue ratio—above 15% means the fiscal math is breaking
High-Impact (systematic monitoring)
For investors who want early-warning capability:
- Build a dashboard tracking the five early-warning triggers across your EM universe
- Subscribe to sovereign rating alerts from at least two agencies (S&P, Moody's, or Fitch)
- Review ICRG or comparable political risk scores semi-annually for governance trend shifts
- Track net international investment position trends (the 30-percentage-point deterioration signal)
Optional (for concentrated EM allocators)
If you're making single-country bets rather than broad EM index exposure:
- Maintain contacts or research sources for qualitative political assessment in key markets
- Model currency stress scenarios using historical devaluation patterns (35%+ over 3 years pre-default)
- Evaluate debt composition shifts—rising foreign-currency and short-term shares signal growing fragility
Next Step (Put This Into Practice)
Pick the three largest emerging-market exposures in your portfolio right now and score them across the five pillars.
How to do it:
- Pull GDP growth, inflation, and reserve data from the IMF World Economic Outlook database (free, updated quarterly)
- Get fiscal balance and debt-to-GDP from the same source; check external debt against the World Bank International Debt Statistics
- Score political/governance using World Bank Governance Indicators (free) and Transparency International's CPI
- Check equity market cap and foreign ownership restrictions via the relevant stock exchange websites or MSCI index methodology documents
- Weight the scores using the 25/20/20/20/15 framework and compare your composite against the position-sizing rules
Interpretation:
- All three score below 2.5: Your EM allocation is well-positioned—maintain and monitor quarterly
- One scores above 3.5: Evaluate whether your position size reflects the elevated risk, and increase monitoring frequency to monthly
- Any score above 4.0: Reduce or eliminate that position—you're not being compensated for the risk you're taking
Action: If any of your top three EM exposures scores above 3.5 and you haven't adjusted position size, do it this week. The investors who got hurt in Sri Lanka, Argentina, and Turkey weren't wrong about the opportunities—they were wrong about the position sizing relative to the risks they were taking.
Related Articles
Nearshoring and Manufacturing Relocation
Explore how nearshoring is reshaping global supply chains, benefiting Mexico and Southeast Asia, and affecting key US industry sectors.
Tracking WTO and Geopolitical Developments
Build a systematic workflow for monitoring WTO disputes and geopolitical trade developments that may affect your investment portfolio.

Using Options for Tail-Risk Hedges
Tail-risk hedging in FX is about paying a known premium to survive the move that breaks your budget. Here is when options beat forwards and how to structure them.