Global Logistics Bottlenecks
Global supply chains operate like a vast plumbing system connecting factories to consumers. When that system flows smoothly, goods move efficiently and costs stay stable. When bottlenecks develop, the effects cascade through the economy, from port congestion raising shipping costs to inventory shortages pushing up consumer prices. For US investors, recognizing logistics stress before it fully manifests in corporate earnings and inflation data provides an analytical edge.
What Logistics Bottlenecks Are
A logistics bottleneck occurs when the flow of goods exceeds the capacity of transportation, handling, or storage infrastructure at some point in the supply chain. Like water backing up behind a dam, goods accumulate on one side while shortages develop on the other.
Bottlenecks can form at multiple points:
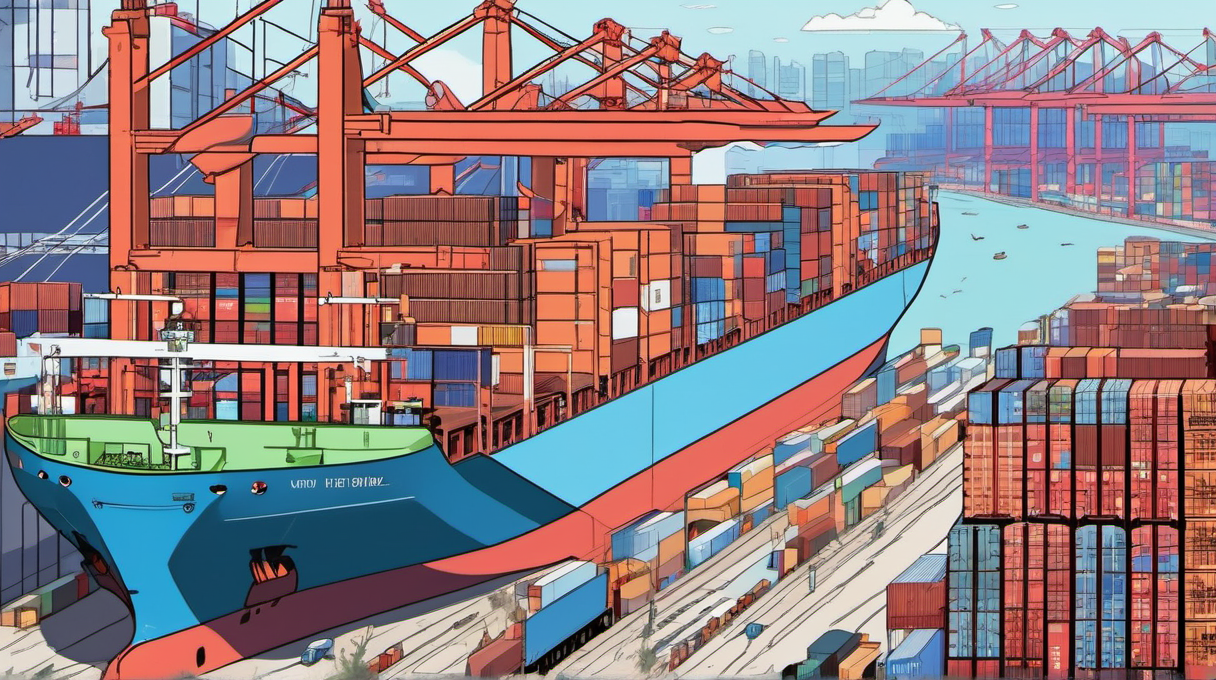
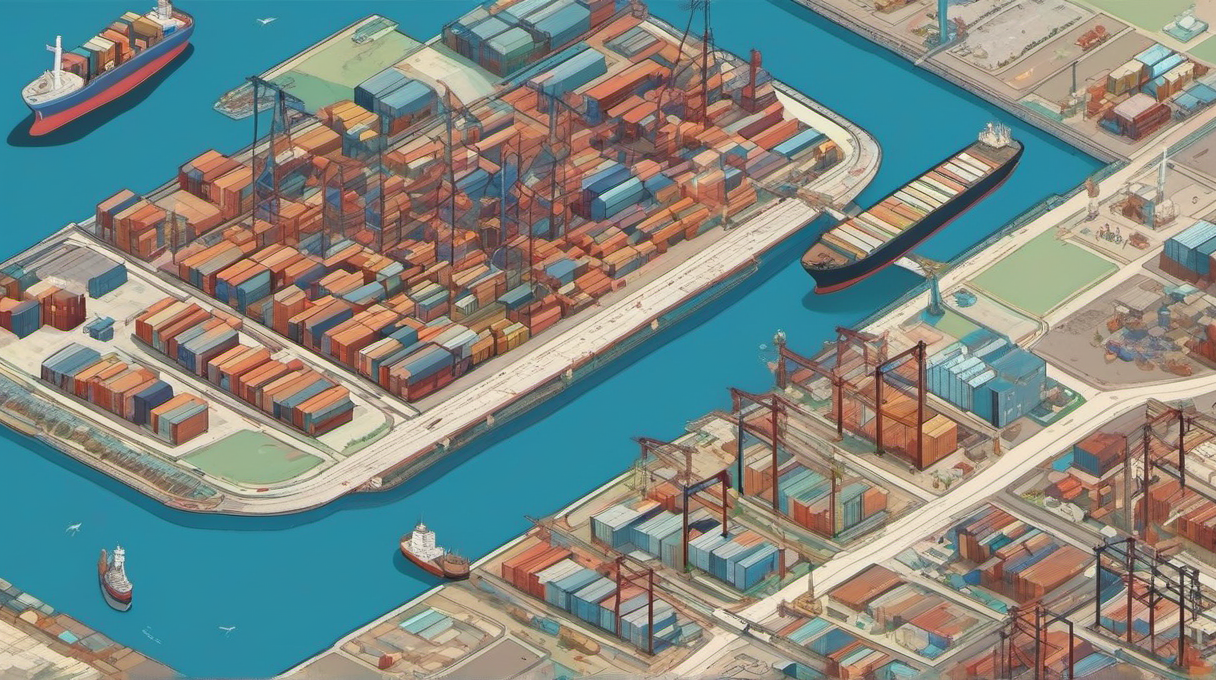
Port Congestion: Ships waiting to unload, insufficient crane capacity, truck and rail limitations moving containers inland.
Shipping Capacity Constraints: Insufficient vessel availability, equipment imbalances (empty containers in wrong locations), route capacity limits (canal transits).
Inland Transportation: Truck driver shortages, rail network congestion, warehouse capacity limitations.
Border and Customs: Inspection delays, paperwork processing backlogs, policy-related disruptions.
The 2021-2022 supply chain crisis demonstrated how bottlenecks compound. Port congestion created ship queues, which tied up containers, which created equipment shortages at origin ports, which delayed subsequent shipments, creating a self-reinforcing spiral.
Cascading Effects of a Port Bottleneck:
| Stage | Impact | Time to Manifest |
|---|---|---|
| Ships queue at port | Vessel availability declines | Days |
| Container dwell time increases | Equipment shortage develops | 1-2 weeks |
| Inland transport overwhelmed | Warehouse congestion | 2-4 weeks |
| Shipping rates spike | Import costs rise | Immediate |
| Inventory shortages develop | Product availability drops | 4-8 weeks |
| Consumer prices increase | Inflation impact | 2-6 months |
Key Indicators: Shipping Rates and Indexes
Several indices track shipping market conditions, each providing different insights:
Container Shipping Rates
Container rates measure the cost of moving standardized containers (TEUs - twenty-foot equivalent units) on major trade lanes. These rates directly affect import costs for consumer goods, electronics, and manufactured products.
Key Metrics:
- Freightos Baltic Index (FBX): Tracks spot rates on major container routes
- Drewry World Container Index: Weekly composite of container rates
- Shanghai Containerized Freight Index (SCFI): Rates from Shanghai to major destinations
Historical Context:
| Period | Asia-US West Coast Rate | Context |
|---|---|---|
| 2019 Average | $1,500/FEU | Pre-pandemic normal |
| April 2020 | $1,300/FEU | Pandemic demand collapse |
| September 2021 | $20,600/FEU | Peak congestion crisis |
| December 2023 | $2,100/FEU | Normalized but elevated |
| January 2024 | $3,900/FEU | Red Sea disruption spike |
The 2021 spike represented a 13x increase from pre-pandemic levels, demonstrating how capacity constraints create nonlinear price responses.
Baltic Dry Index (BDI)
The Baltic Dry Index tracks rates for dry bulk shipping (iron ore, coal, grain, other commodities). Unlike container rates, the BDI responds primarily to commodity trade volumes and vessel supply.
Why BDI Matters:
- Leading indicator of industrial demand and commodity trade
- No financial derivative influence (purely physical market)
- Historically correlated with global GDP growth
BDI Ranges:
| Level | Interpretation |
|---|---|
| Below 1,000 | Shipping depression; over-capacity |
| 1,000-2,000 | Normal/balanced market |
| 2,000-3,000 | Strong demand; tight capacity |
| Above 3,000 | Boom conditions; potential shortages |
The BDI peaked above 11,000 in 2008 during the commodity super-cycle, crashed to below 300 in 2016, and has ranged between 1,000 and 3,500 in recent years.
Tanker Rates
Oil and product tanker rates affect energy costs and refining economics. Key benchmarks include:
- VLCC (Very Large Crude Carrier) rates: Crude oil transport
- Clean product tanker rates: Refined products (gasoline, diesel)
Tanker rate spikes during the 2022 Russia sanctions period added to energy cost pressures beyond crude price movements.
Port Congestion Metrics
Port performance data provides early warning of developing bottlenecks:
Ship Queue Counts The number of vessels waiting at anchor to unload. During the 2021 crisis, over 100 ships waited at Los Angeles/Long Beach, compared to typical levels of zero to five.
Container Dwell Time How long containers sit at the port before inland pickup. Normal dwell time runs 3-5 days; crisis periods saw 8-12 days or more.
Berth Productivity Container moves per hour at ship-to-shore cranes. Declining productivity signals labor, equipment, or coordination problems.
Key US Ports to Monitor:
- Los Angeles/Long Beach (40% of US container imports)
- Savannah (fast-growing East Coast gateway)
- New York/New Jersey (largest East Coast port)
- Houston (Gulf Coast, industrial imports)
Global Chokepoints:
- Suez Canal (12% of global trade)
- Panama Canal (5% of global trade, drought-constrained)
- Strait of Malacca (Singapore transshipment hub)
- Strait of Hormuz (oil exports from Persian Gulf)
Shipping Rate Dynamics and Cycles
Shipping rates exhibit pronounced cyclicality driven by the mismatch between slow-to-adjust capacity and volatile demand:
Supply Side Characteristics:
- New vessels take 2-4 years from order to delivery
- Ships have 20-25 year lifespans
- Scrapping decisions respond to market conditions
- Fleet capacity adjusts slowly to demand changes
Demand Side Drivers:
- Global trade volumes (tied to GDP growth)
- Inventory restocking cycles
- Seasonal patterns (pre-holiday shipping surge)
- Route disruptions shifting traffic
The Boom-Bust Pattern:
- Strong demand exceeds available capacity
- Rates spike, generating exceptional profits
- Ship orders surge at elevated prices
- New capacity delivers 2-4 years later
- Oversupply develops as demand normalizes
- Rates crash, causing industry losses
- Ship scrapping accelerates
- Capacity rebalances; cycle repeats
Container shipping industry profitability swung from near-zero in 2019 to over $200 billion in combined profits in 2021-2022, back to modest levels by 2023 as capacity normalized.
Impact on Inflation and Corporate Margins
Logistics costs transmit to the broader economy through multiple channels:
Direct Import Cost Increases When shipping rates triple, imported goods costs rise proportionally to shipping as a share of landed cost. A $100 item with $5 historical shipping cost might see that component rise to $15, adding 10% to consumer price.
Inventory Investment Longer transit times require more inventory to maintain service levels. Higher inventory at higher financing costs compresses working capital efficiency.
Production Disruptions Component shortages halt production lines. Automotive plants in 2021-2022 frequently idled due to semiconductor and other part shortages, reducing output despite strong demand.
Inflation Transmission Timing:
| Stage | Lag from Shipping Shock |
|---|---|
| Import price index | 1-2 months |
| Producer price index | 2-4 months |
| Consumer price index | 3-6 months |
| Second-round wage effects | 6-12 months |
The 2021-2022 experience demonstrated these lags clearly. Shipping rates peaked in September 2021, producer prices peaked in March 2022, and consumer goods inflation peaked mid-2022.
Margin Impacts by Sector:
| Sector | Exposure | Typical Response |
|---|---|---|
| Retail (general merchandise) | High | Price increases; margin compression |
| Automotive | High | Production cuts; dealer inventory depletion |
| Consumer electronics | High | Price increases; product delays |
| Industrial distributors | Medium | Price pass-through; inventory build |
| Food retail | Medium | Selective price increases |
| E-commerce | High | Shipping surcharges; delivery delays |
Companies with pricing power (strong brands, limited competition) passed through cost increases more successfully than those in competitive commodity businesses.
Monitoring Checklist for Investors
Tracking logistics conditions requires monitoring several data sources:
Weekly/Daily Indicators:
- Container spot rates (Freightos, Drewry)
- Baltic Dry Index (daily)
- Vessel queue counts at major ports
- Fuel costs (bunker prices)
Monthly Data:
- Port throughput statistics (TEU volumes)
- Import/export volumes (Census Bureau)
- Inventory-to-sales ratios (wholesale, retail)
- Manufacturing PMI delivery time component
Real-Time Sources:
- Marine traffic tracking (vessel positions)
- Satellite imagery of port activity
- Social media from port workers/truckers
- Industry publications (Journal of Commerce, FreightWaves)
Sample Dashboard:
| Indicator | Current Level | Historical Range | Signal |
|---|---|---|---|
| FBX Global Container | $2,400 | $1,200-$20,000 | Elevated but normalizing |
| LA/LB Ship Queue | 5 vessels | 0-110 vessels | Normal |
| BDI | 1,850 | 290-11,793 | Moderate |
| ISM Delivery Times | 52 | 28-78 | Balanced |
Current Landscape and Ongoing Risks
As of late 2023 into 2024, the logistics environment presents a mixed picture:
Normalized Areas:
- Container shipping capacity adequate (large orderbook delivered)
- US port congestion resolved
- Truck and rail capacity available
- Inventory levels healthy at retailers
Emerging Stress Points:
- Red Sea/Suez disruption (Houthi attacks diverting ships)
- Panama Canal drought restricting transits
- Potential labor actions at US ports
- Geopolitical risks to key chokepoints
The Red Sea disruption illustrates ongoing vulnerability. Attacks on commercial shipping in late 2023 forced major carriers to reroute around Africa, adding 10-14 days transit time and approximately $1 million per voyage in fuel costs. Container rates from Asia to Europe doubled within weeks.
Practical Investment Applications
Understanding logistics bottlenecks helps with several investment decisions:
Timing Sector Rotations: Transportation stocks (shipping lines, truckers, railroads) outperform when rates rise and underperform during overcapacity. Container shipping stocks tripled in 2021 before falling 50%+ by 2023.
Identifying Margin Pressure: Companies mentioning "freight costs," "supply chain," or "logistics challenges" in earnings calls likely face margin headwinds. Natural language processing of earnings transcripts can quantify this systematically.
Inflation Forecasting: Shipping rates provide lead time on goods inflation. Watching rates helps anticipate Federal Reserve policy responses before CPI data confirms the trend.
Company-Specific Analysis: Firms with owned logistics (Amazon), long-term contracts (Walmart), or diversified sourcing face less margin volatility than those exposed to spot markets.
Key Takeaways
Logistics bottlenecks function as a leading indicator of inflation pressures and corporate margin stress. The indicators to watch, container rates, Baltic Dry Index, port congestion metrics, and delivery time surveys, provide early warning of developing problems and eventual normalization.
The 2021-2022 crisis demonstrated both the severity of logistics disruptions and the speed at which conditions can normalize once capacity adjusts. For investors, the lesson is that logistics metrics deserve regular attention, particularly during periods of unusual demand patterns, capacity constraints, or geopolitical disruption affecting key trade routes.
Monitoring this checklist, understanding the transmission mechanisms, and recognizing the cyclical nature of shipping markets helps transform logistics developments from abstract economic concepts into actionable investment insights.
Related Articles

Currency Pegs vs. Floating Regimes
Compare fixed and floating exchange rate systems, understand reserve requirements, and identify devaluation risks for emerging market investing.
Nearshoring and Manufacturing Relocation
Explore how nearshoring is reshaping global supply chains, benefiting Mexico and Southeast Asia, and affecting key US industry sectors.

Election Cycles and Market Volatility
Elections create policy uncertainty that affects market volatility and sector performance. Understanding historical patterns and policy uncertainty indicators helps investors navigate election periods.